
- Introduction
- Prerequisites
- Step 1. Provision device
- Step 2. Connect device
- Step 3. Create dashboard
- Step 4. Configure alarm rules
- Step 5. Create alarm
- Step 6. Alarm notifications
- Step 7. Share dashboard with customers
- Next steps
Introduction
The goal of this tutorial is to demonstrate the basic usage of the most popular IoT Hub features. You will learn how to:
- Connect devices to IoT Hub;
- Push data from devices to IoT Hub;
- Build real-time end-user dashboards;
- Define thresholds and trigger alarms;
- Push notification about new alarms over email, SMS, or other systems.
In this guide, we will connect and visualize data from the temperature sensor to keep it simple.
Prerequisites
You will need to have access to IoT Hub.
Step 1. Provision device
For simplicity, we will provision device manually using the UI.
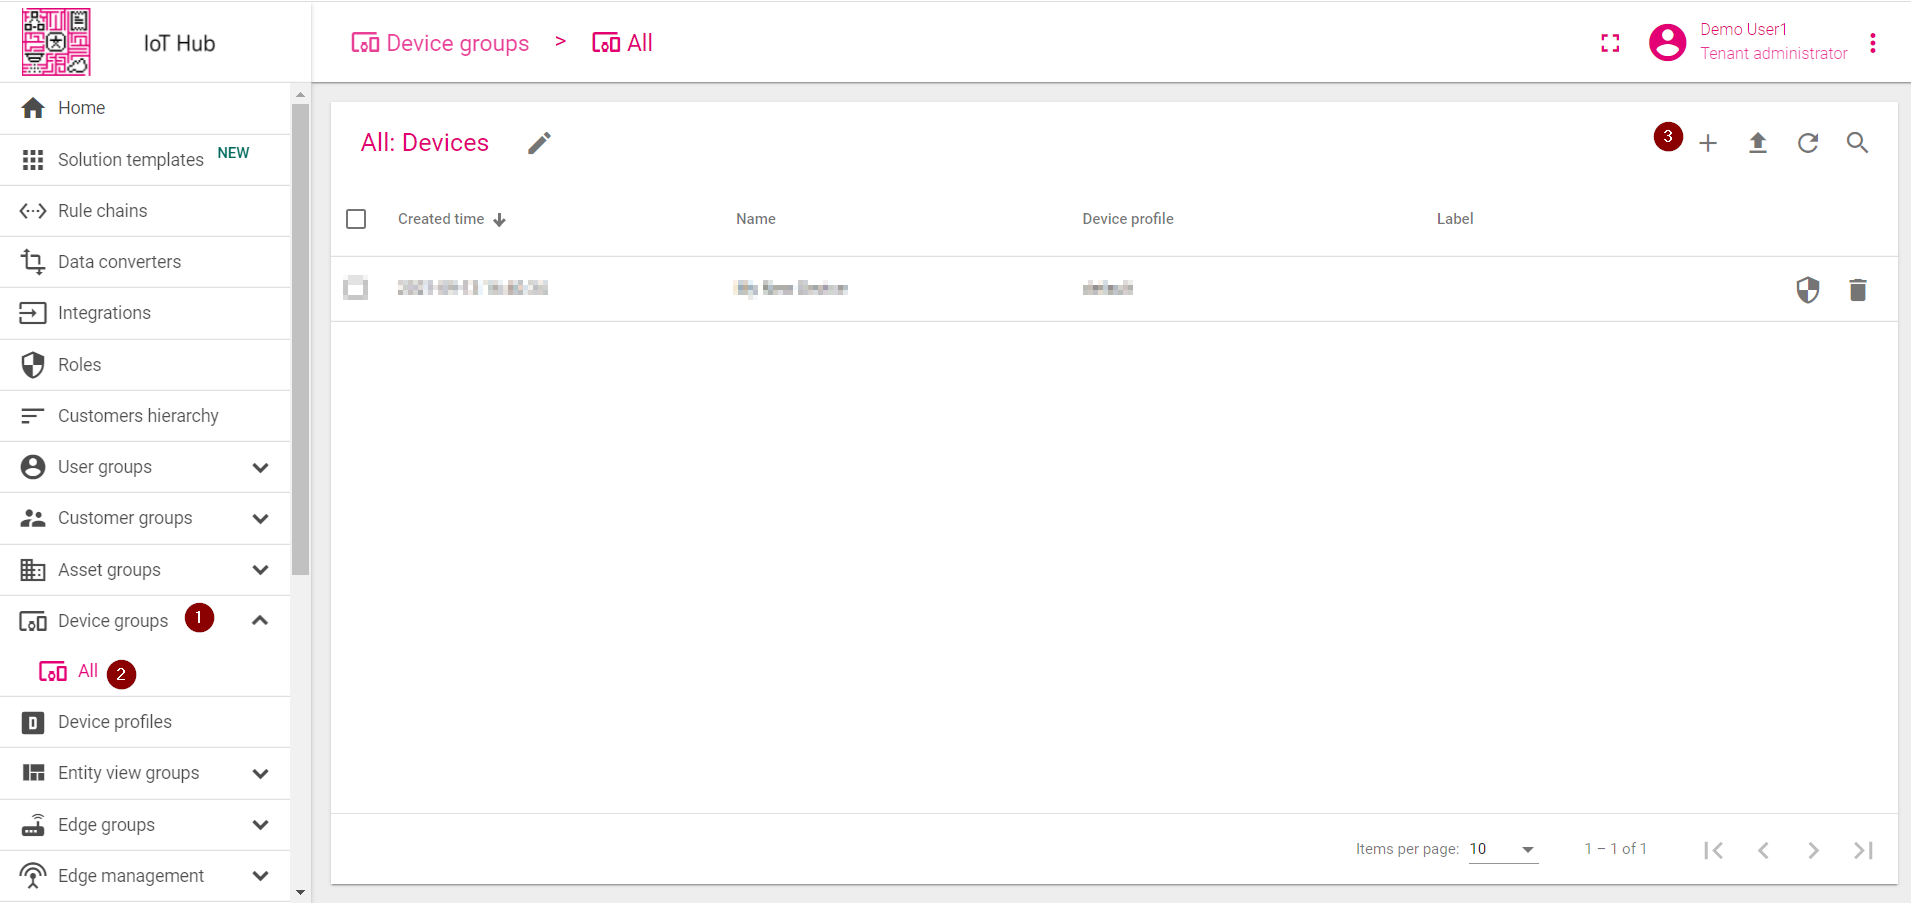
- Login to your IoT Hub instance and open Device Groups(1) page,
Navigate to default Deivce Group "ALL"(2),
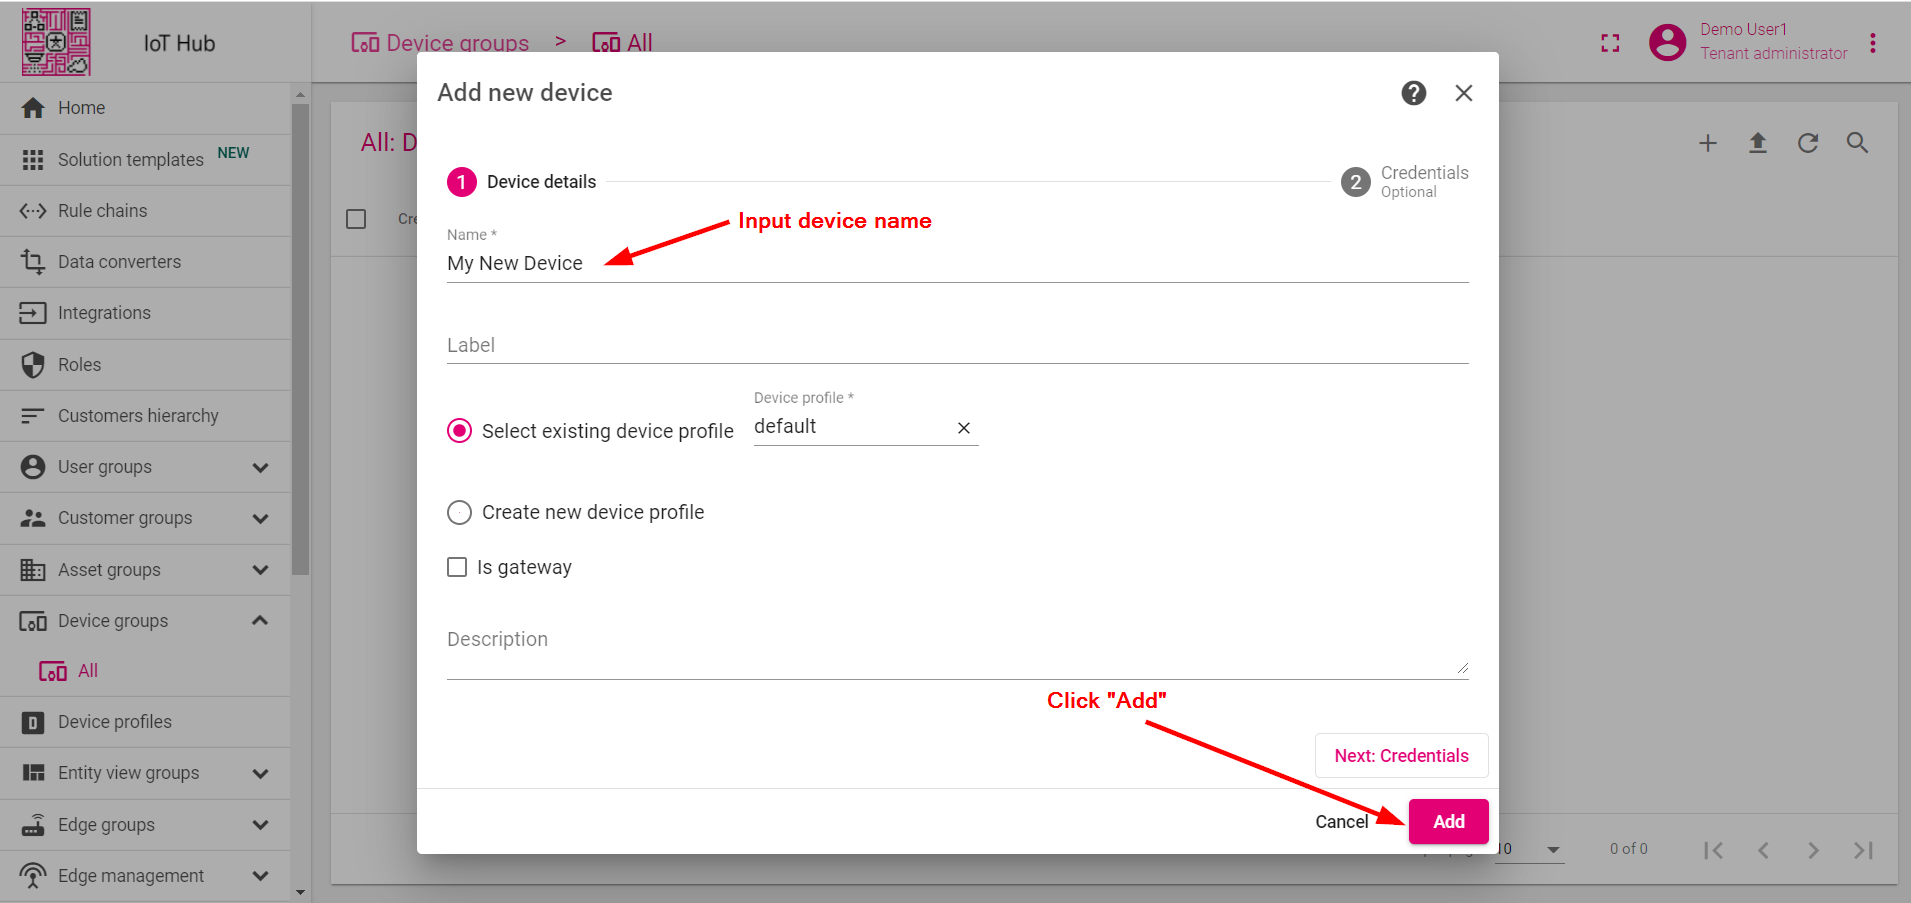
Click on the "+" icon in the top right corner of the table and then select "Add Device"(3). - Input device name. For example, "My New Device". No other changes are required at this time. Click "Add" to add the device.
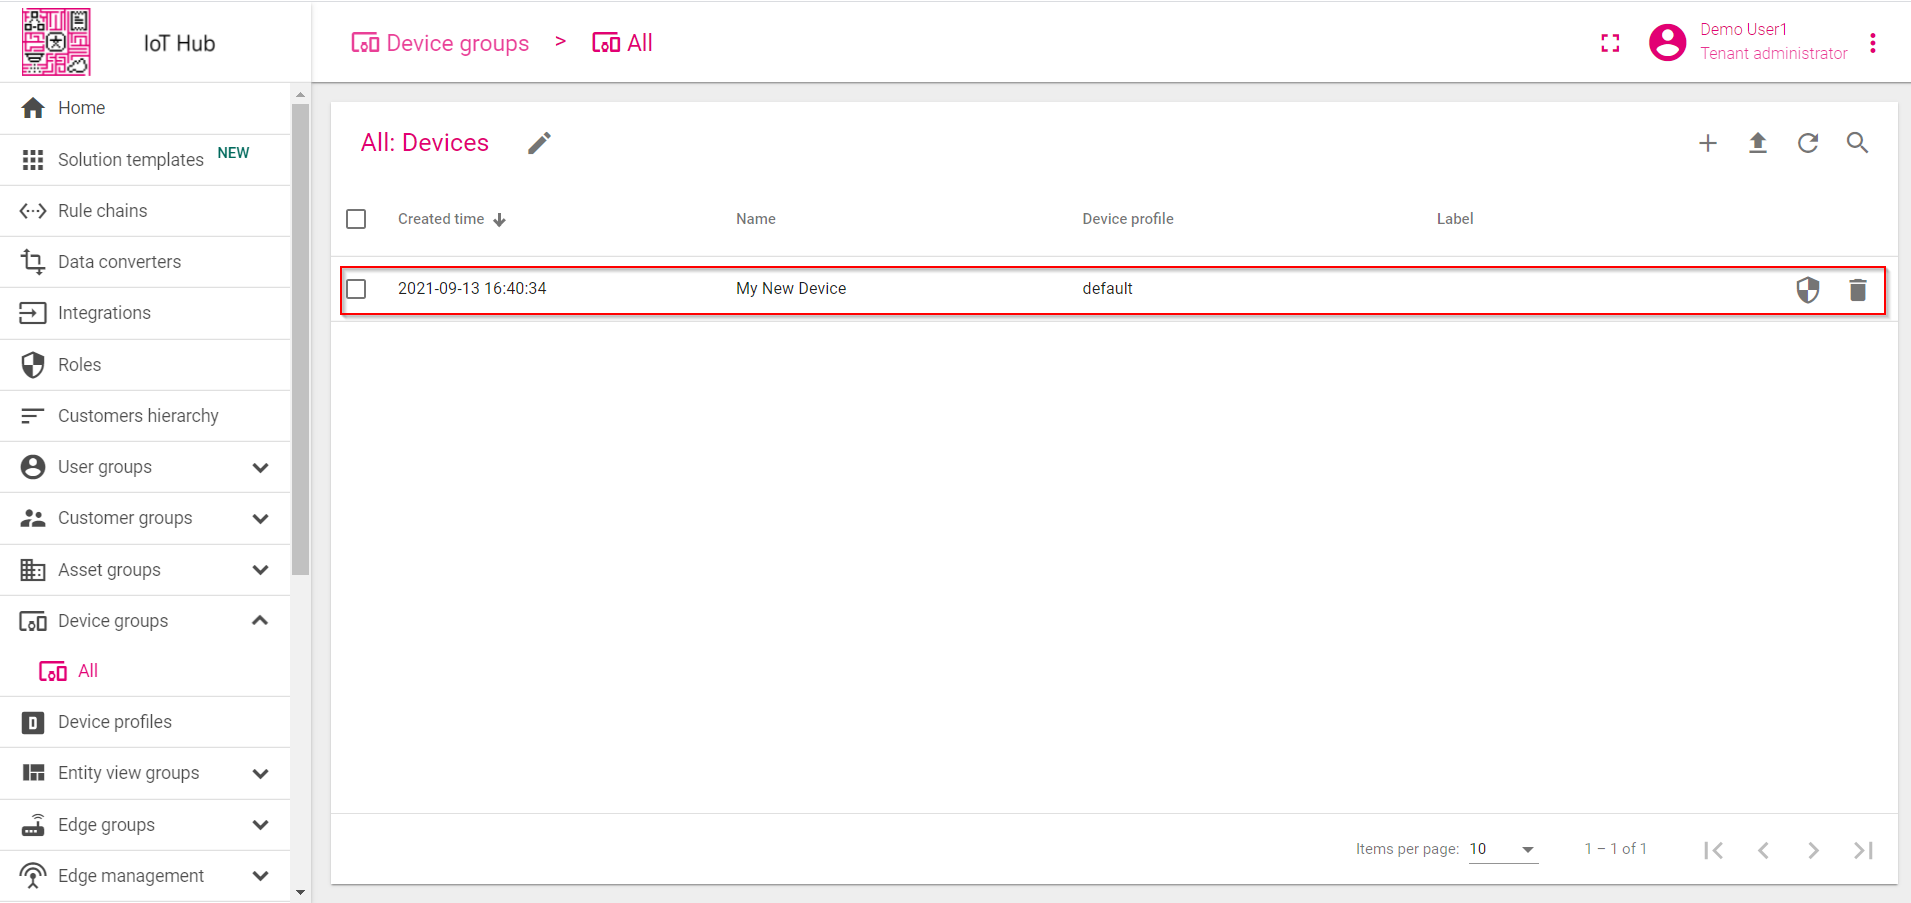
- Now your device should be listed first, since the table sorts devices using the time of the creation by default.
You may also use:
- Bulk provisioning to provision multiple devices from a CSV file using UI;
- Device provisioning to allow device firmware to automatically provision the device, so you don’t need to configure each device manually;
- REST API to provision devices and other entities programmatically;
Step 2. Connect device
To connect the device you need to get the device credentials first. IoT Hub supports various device credentials. We recommend using the default auto-generated credentials which is an access token for this guide.
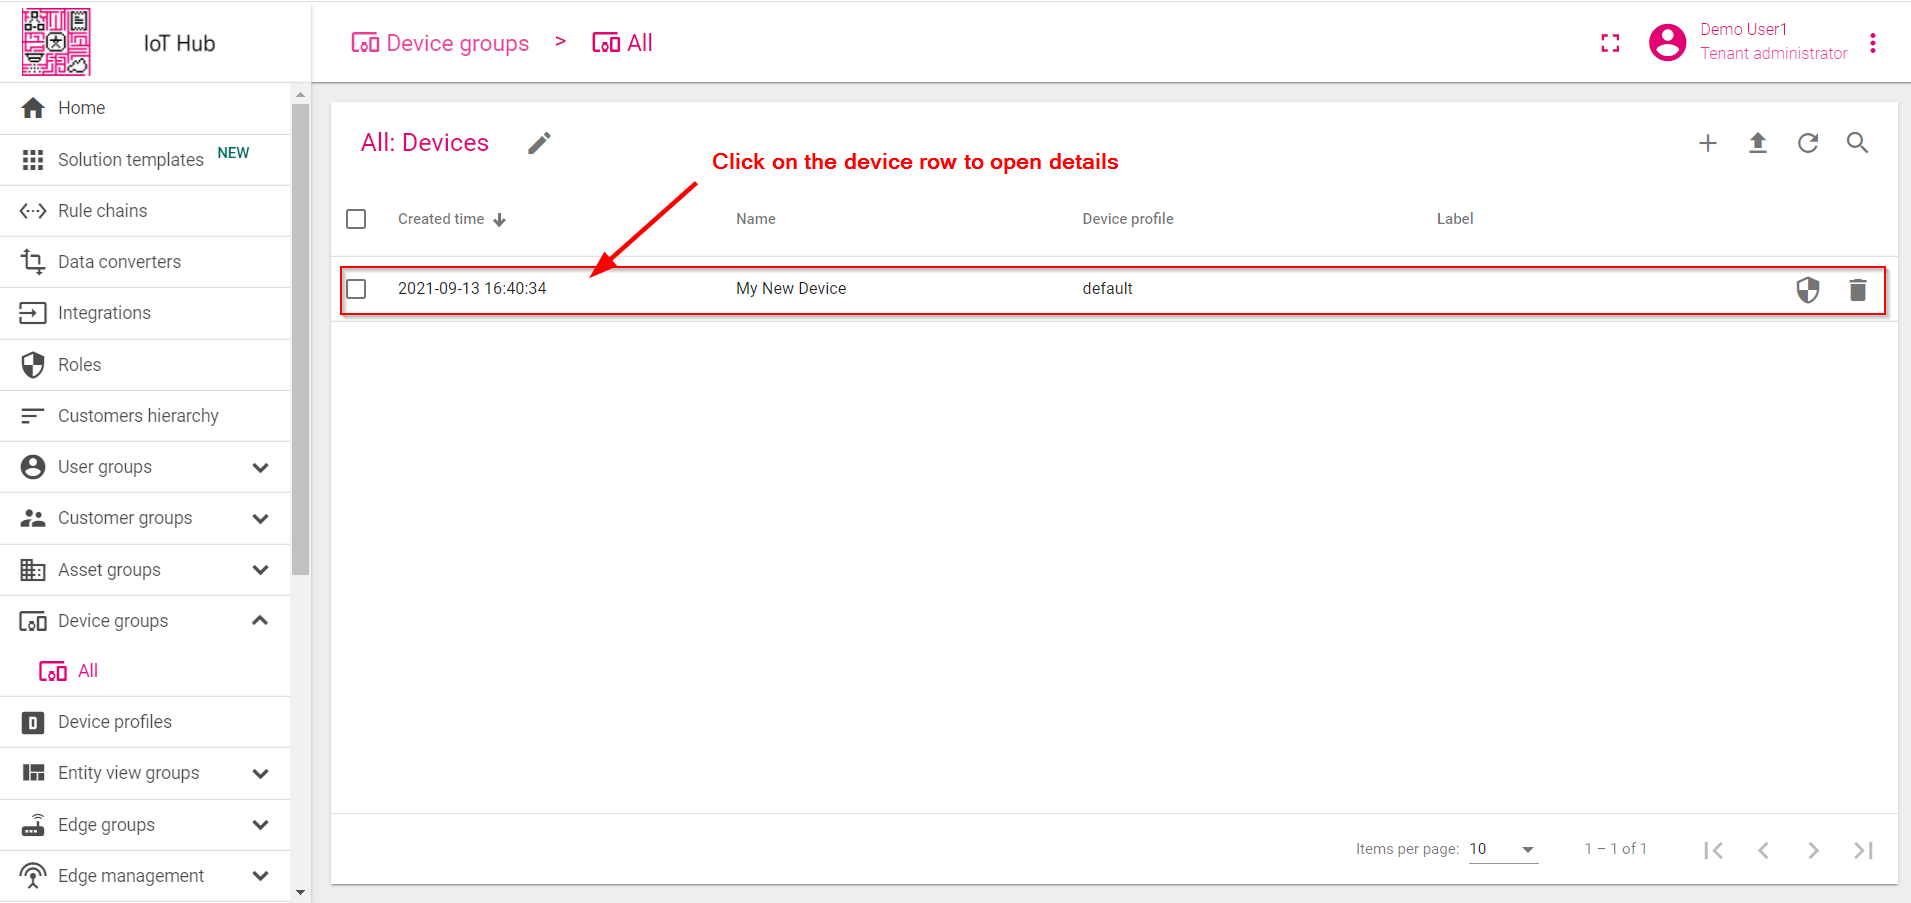
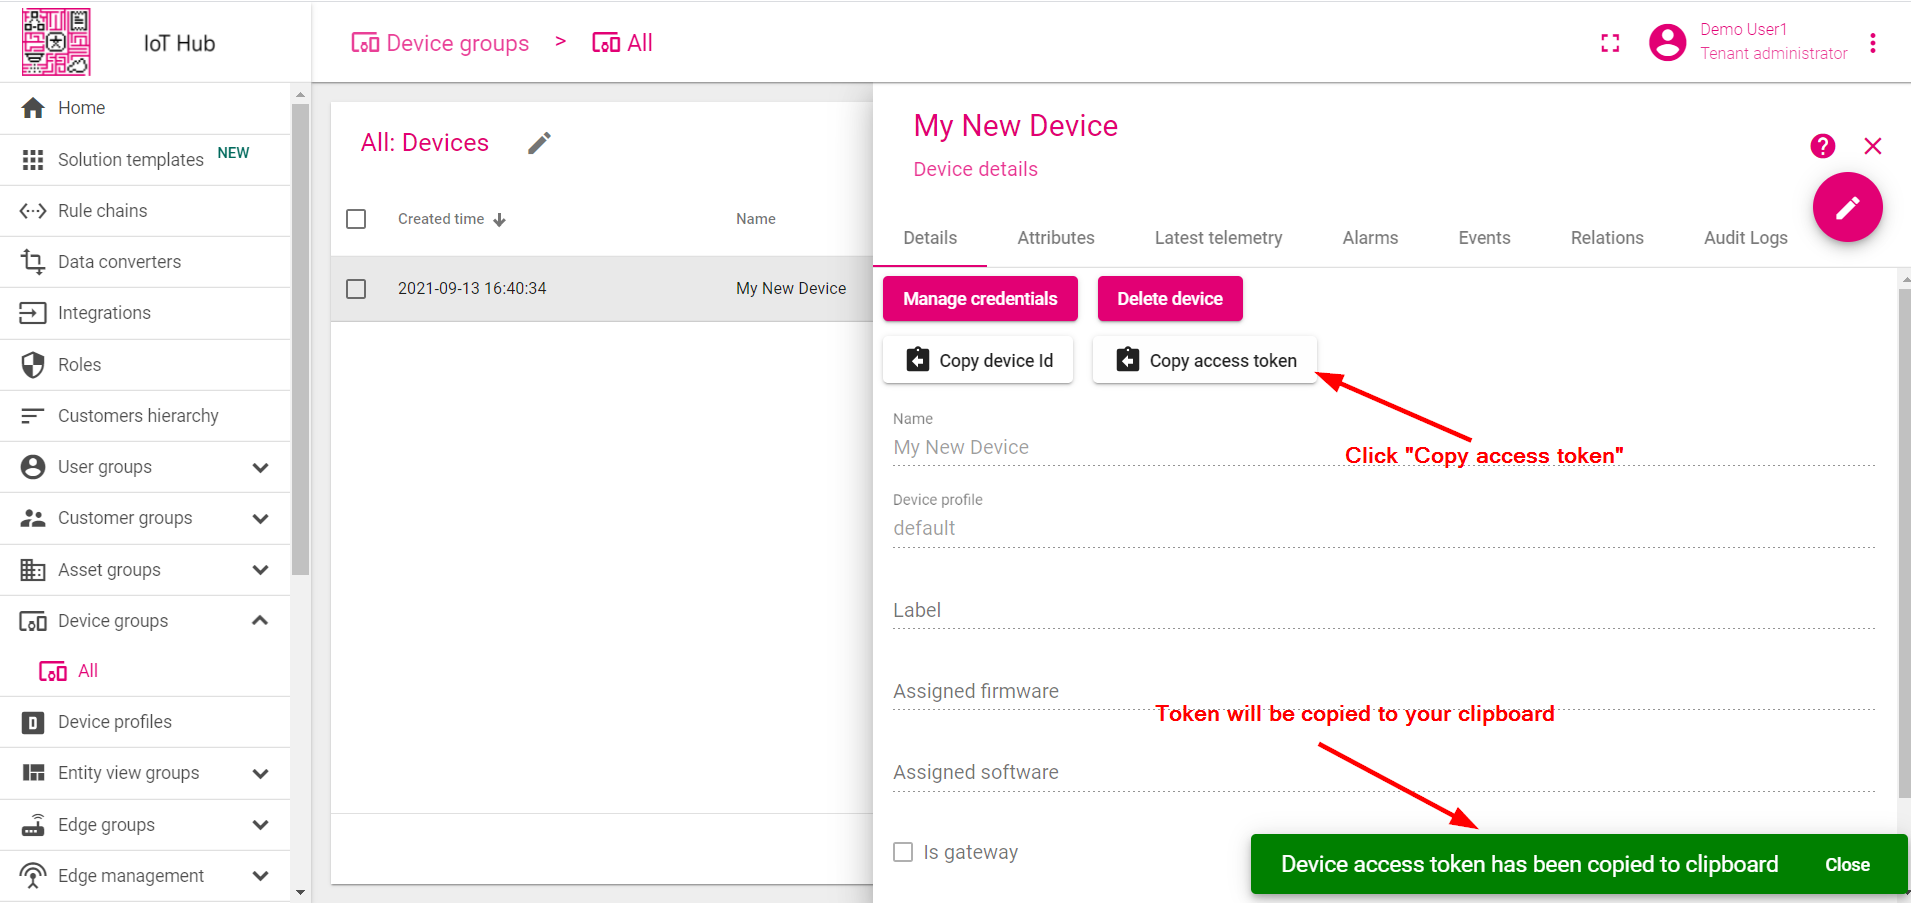
- Click on the device row in the table to open device details;
- Click "Copy access token". Token will be copied to your clipboard. Save it to a safe place.
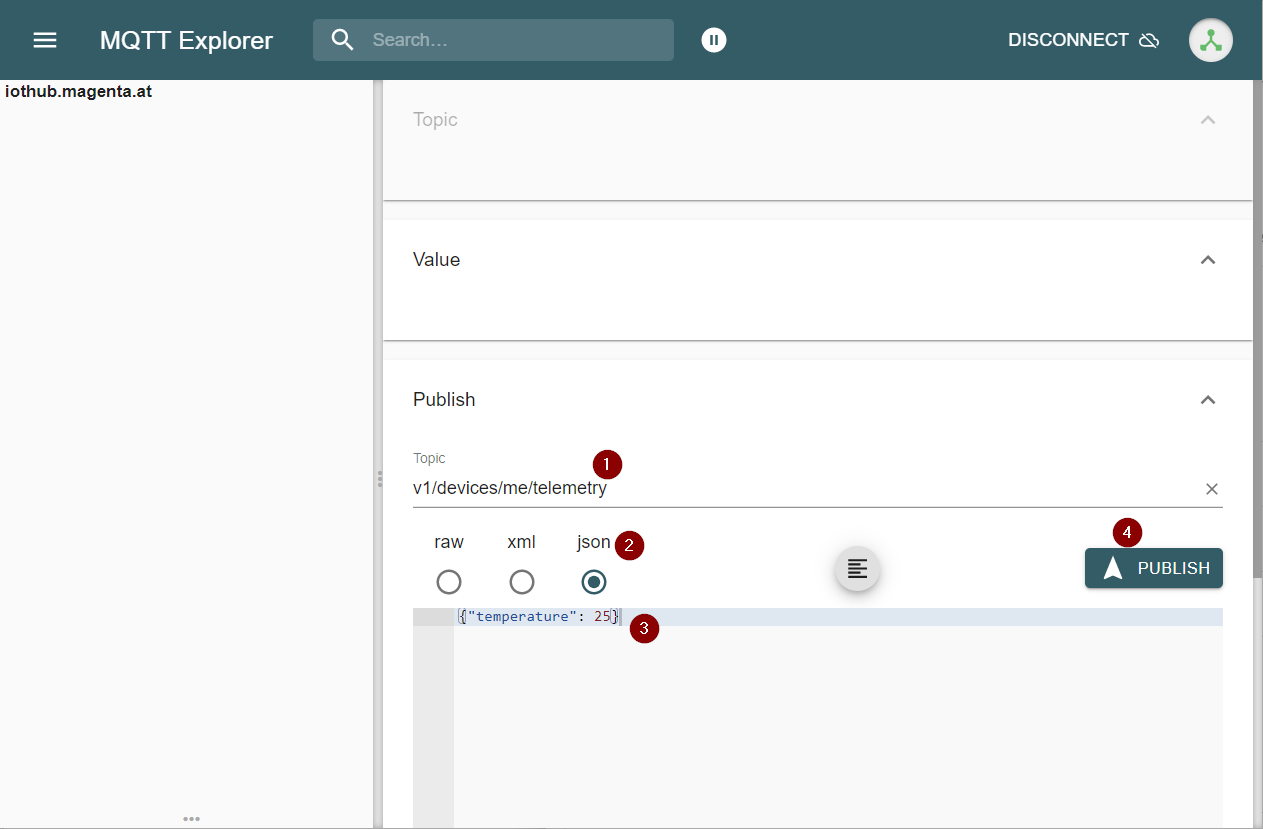
Now you are ready to publish telemetry data on behalf of your device. We will use simple commands to publish data over HTTP or MQTT in this example.
|
Install cURL for Ubuntu: Install cURL for macOS: Install cURL for Windows: Starting Windows 10 b17063, cURL is available by default. More info is available in this MSDB blog post. If you are using older version of Windows OS, you may find official installation guides here. This command works for Windows, Ubuntu and macOS, assuming the cURL tool is already installed. Access via public Internet Direct connected Device (with IoT Hub SIM-Card)
|
|
Install mqtt client for Ubuntu: Install cURL for macOS: Access via public Internet Replace $ACCESS_TOKEN with corresponding values. For access token is ABC123: Direct connected Device (with IoT Hub SIM-Card) For access token is ABC123: Successful output should look similar to this one: Note: You are able to use basic MQTT credentials (combination of client id, user name and password ) and customize topic names and payload type using Device Profile. See more info here.
|
|
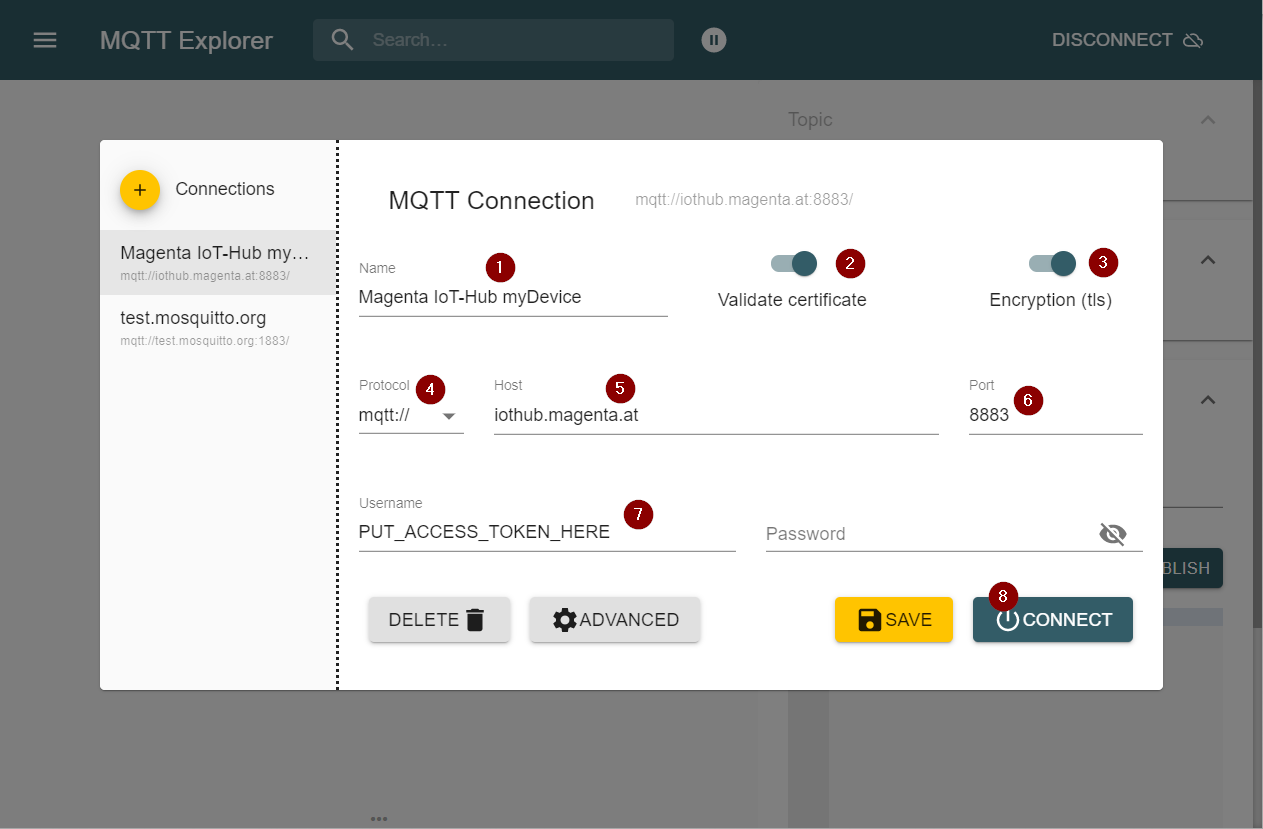
Please install any MQTT-Client in this guide we use MQTT-Explorer.
|
|
Install coap-cli. Assuming you have Node.js and NPM installed on your Windows/Linux/MacOS machine, execute the following command: Access via public Internet Send telemetry data Direct connected Device (with IoT Hub SIM-Card) Replace $ACCESS_TOKEN with corresponding values. For example access token is ABC123:
|
|
IoT Hub supports many other protocols. Please explore Connectivity Diagram to find solution that matches your use case. Note: We recommend to start exploring the platform capabilities with simulated devices that are connected over MQTT.
|
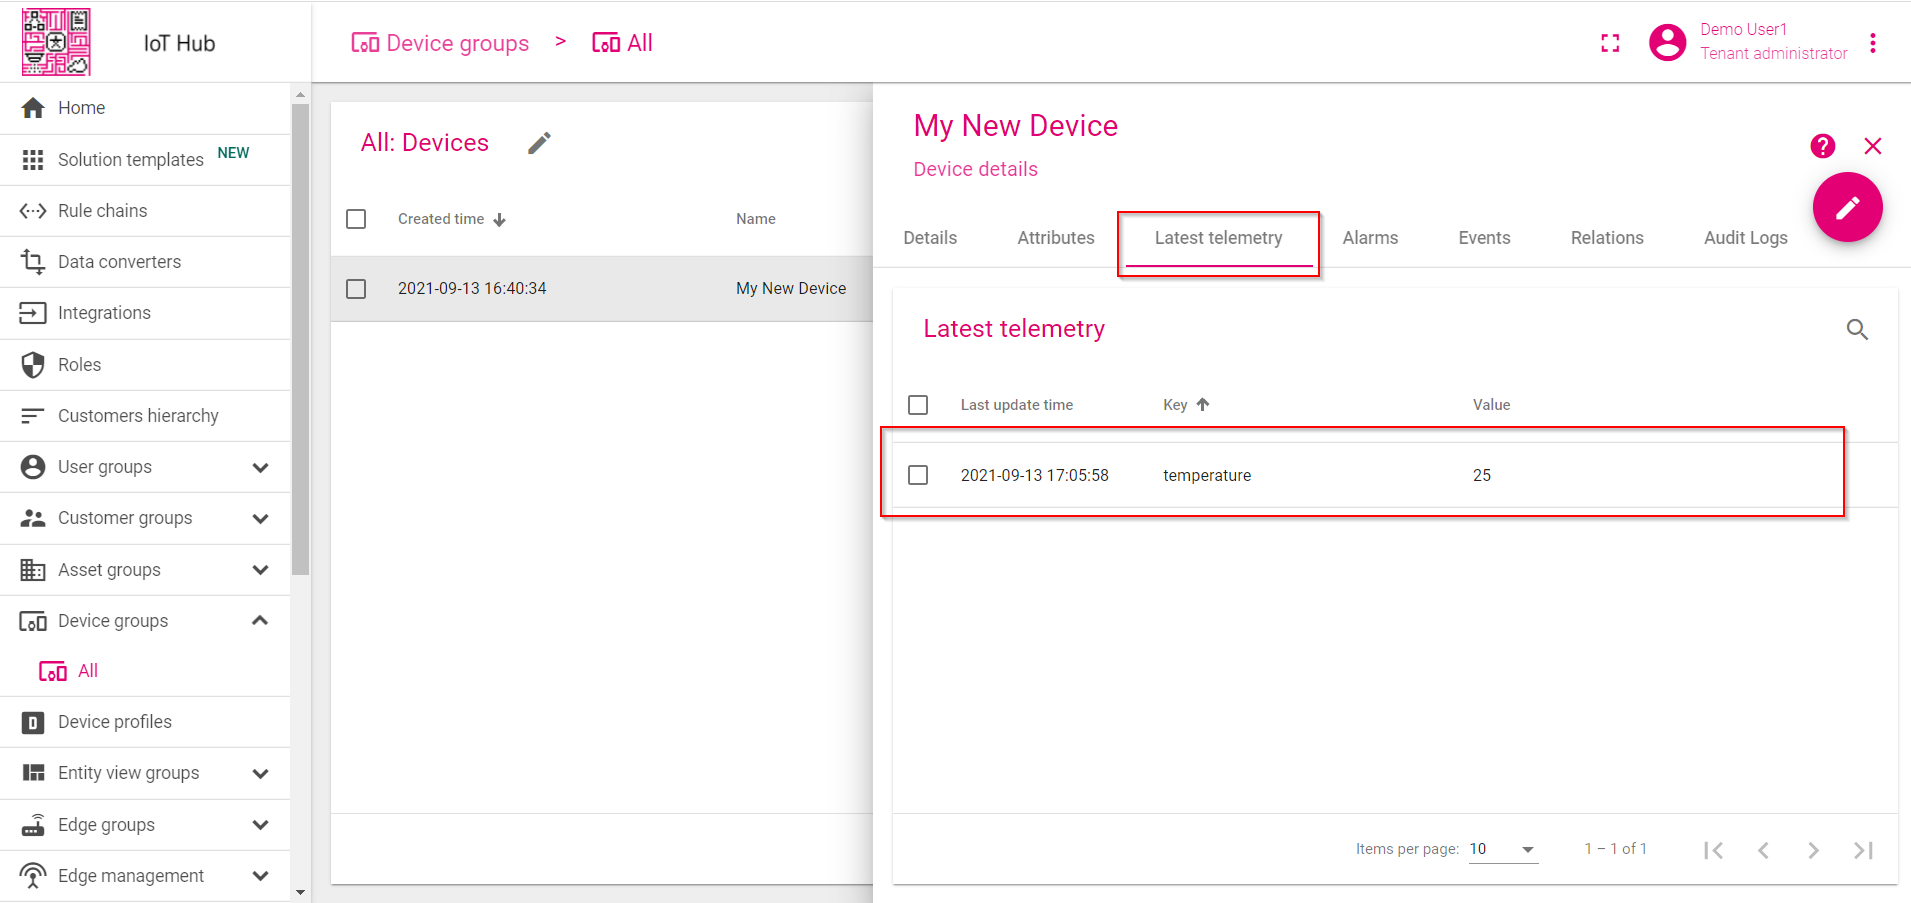
Once you have successfully published the “temperature” readings, you should immediately see them in the Device Telemetry Tab:
- Click on the device row in the table to open device details;
- Navigate to the telemetry tab.
Step 3. Create dashboard
We will create a dashboard to add the most popular widgets. See instructions below.
Step 3.1 Create an empty dashboard
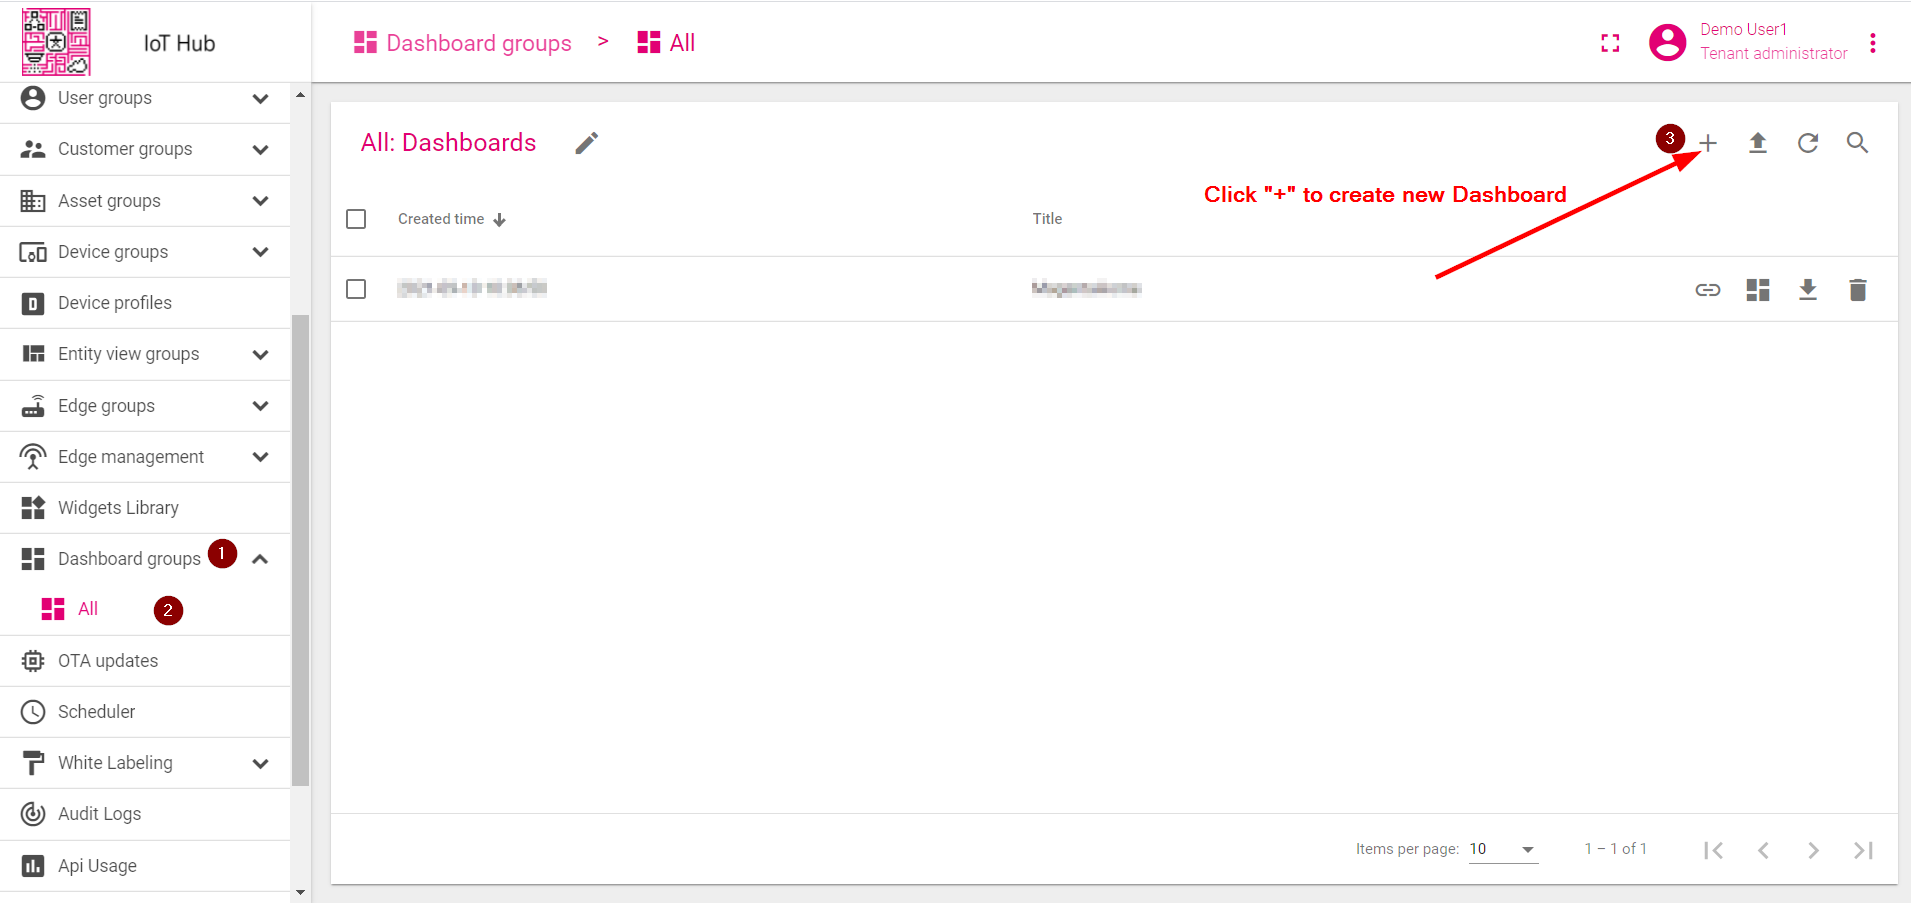
- Open Dashboard Groups page. Open default dashboard group “All”. Click on the "+" icon in the top right corner to create a new dashboard.
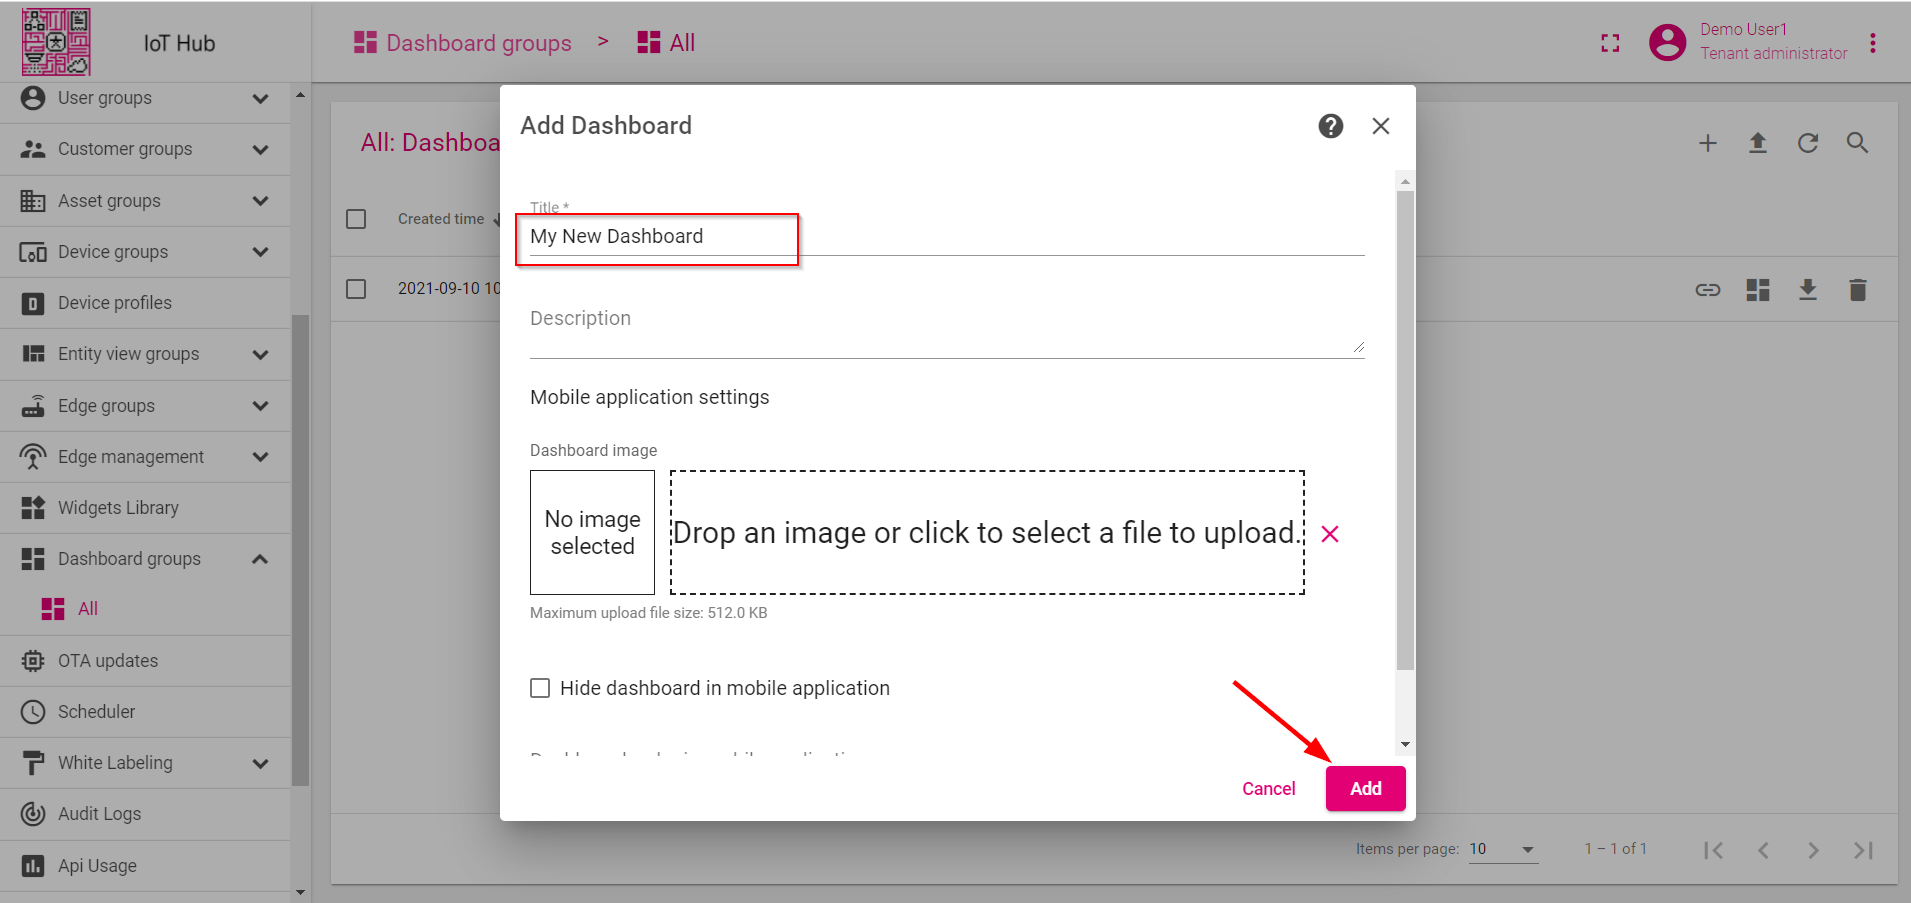
- Input dashboard name. For example, "My New Dashboard". Click "Add" to add the dashboard.
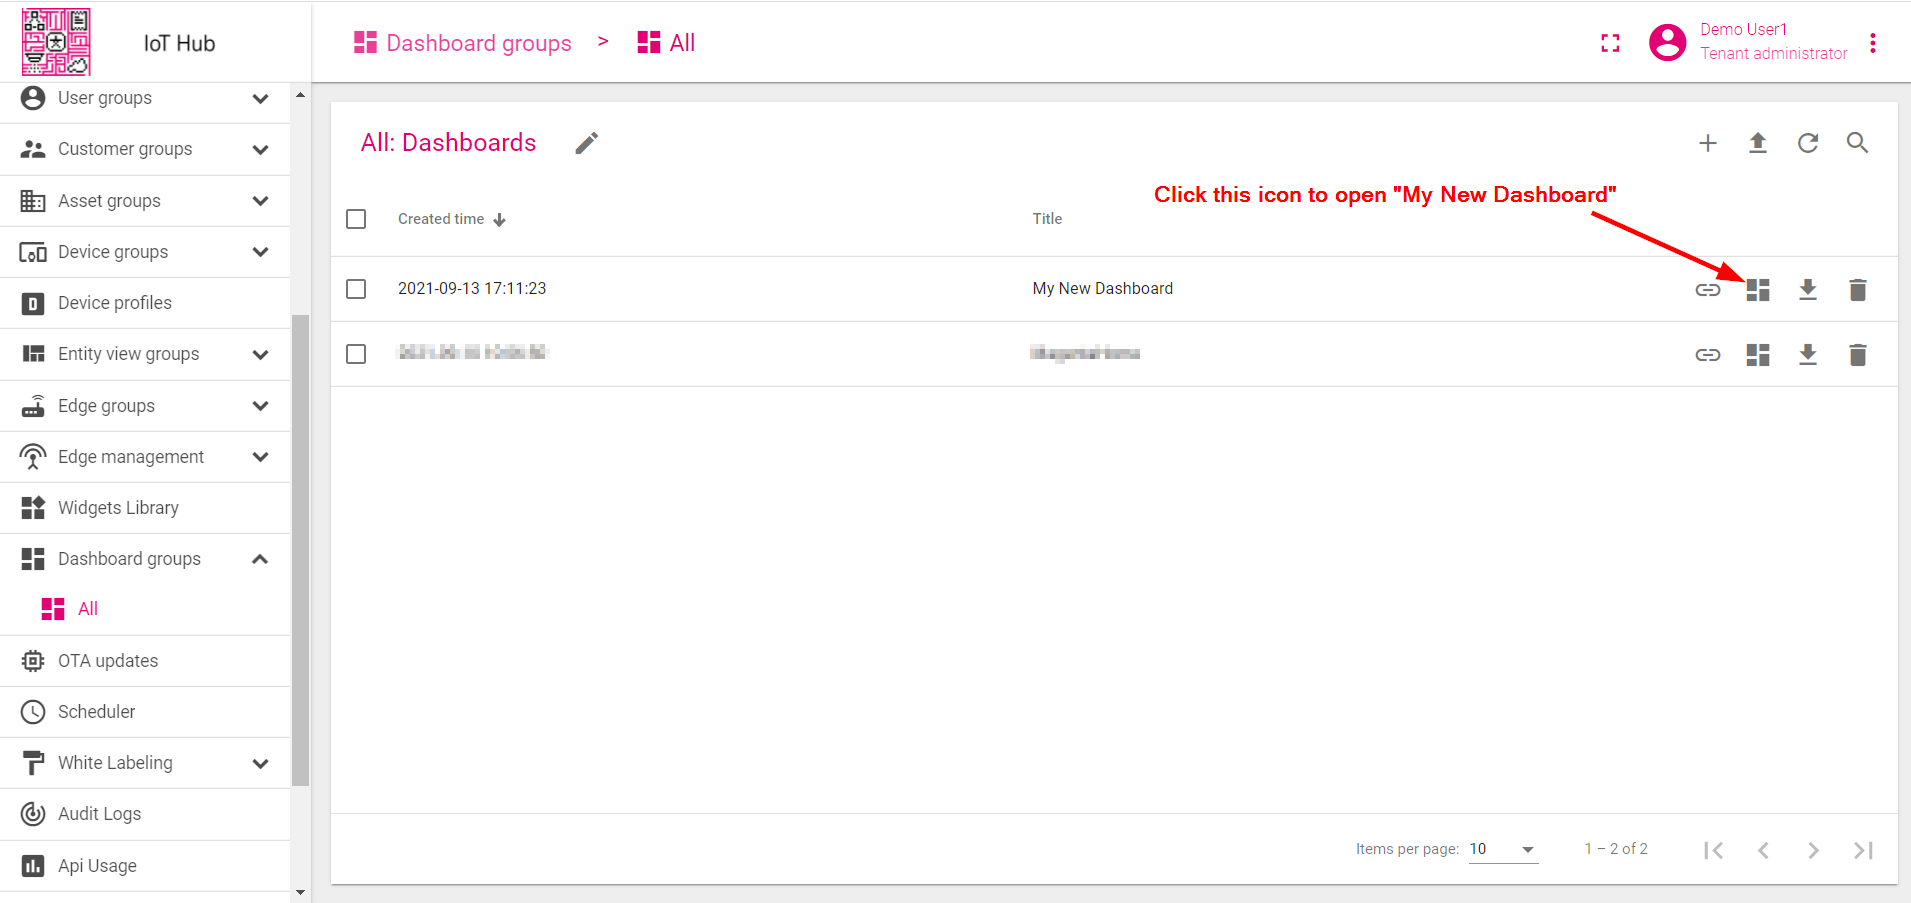
- Now your dashboard should be listed first, since the table sorts dashboards using the time of the creation by default. Click on the "Open dashboard" icon.
Step 3.2 Add entity alias
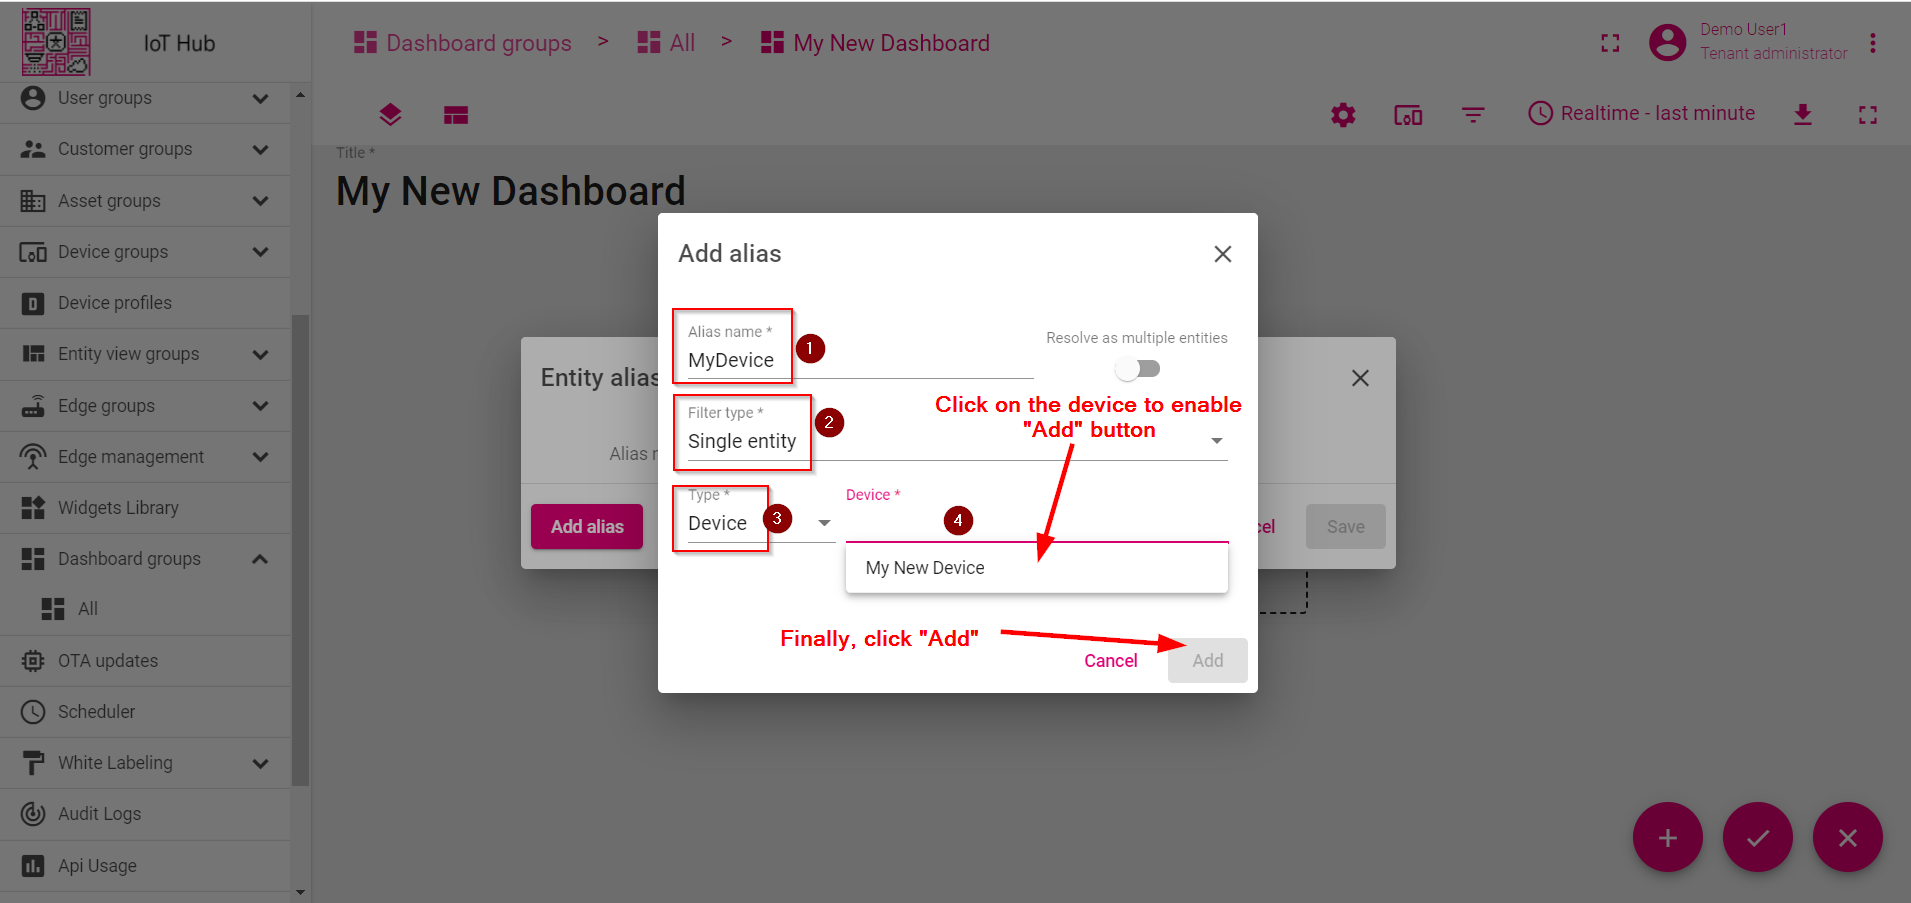
Alias is a reference to a single entity or a group of entities that are used in the widgets. Alias may be static or dynamic. For simplicity, we will use “Single entity” alias reference the one and only entity (“My New Device” in our case). It is possible to configure an alias that references multiple devices. For example, devices of a certain type or related to a certain asset. You may learn more about different aliases here.
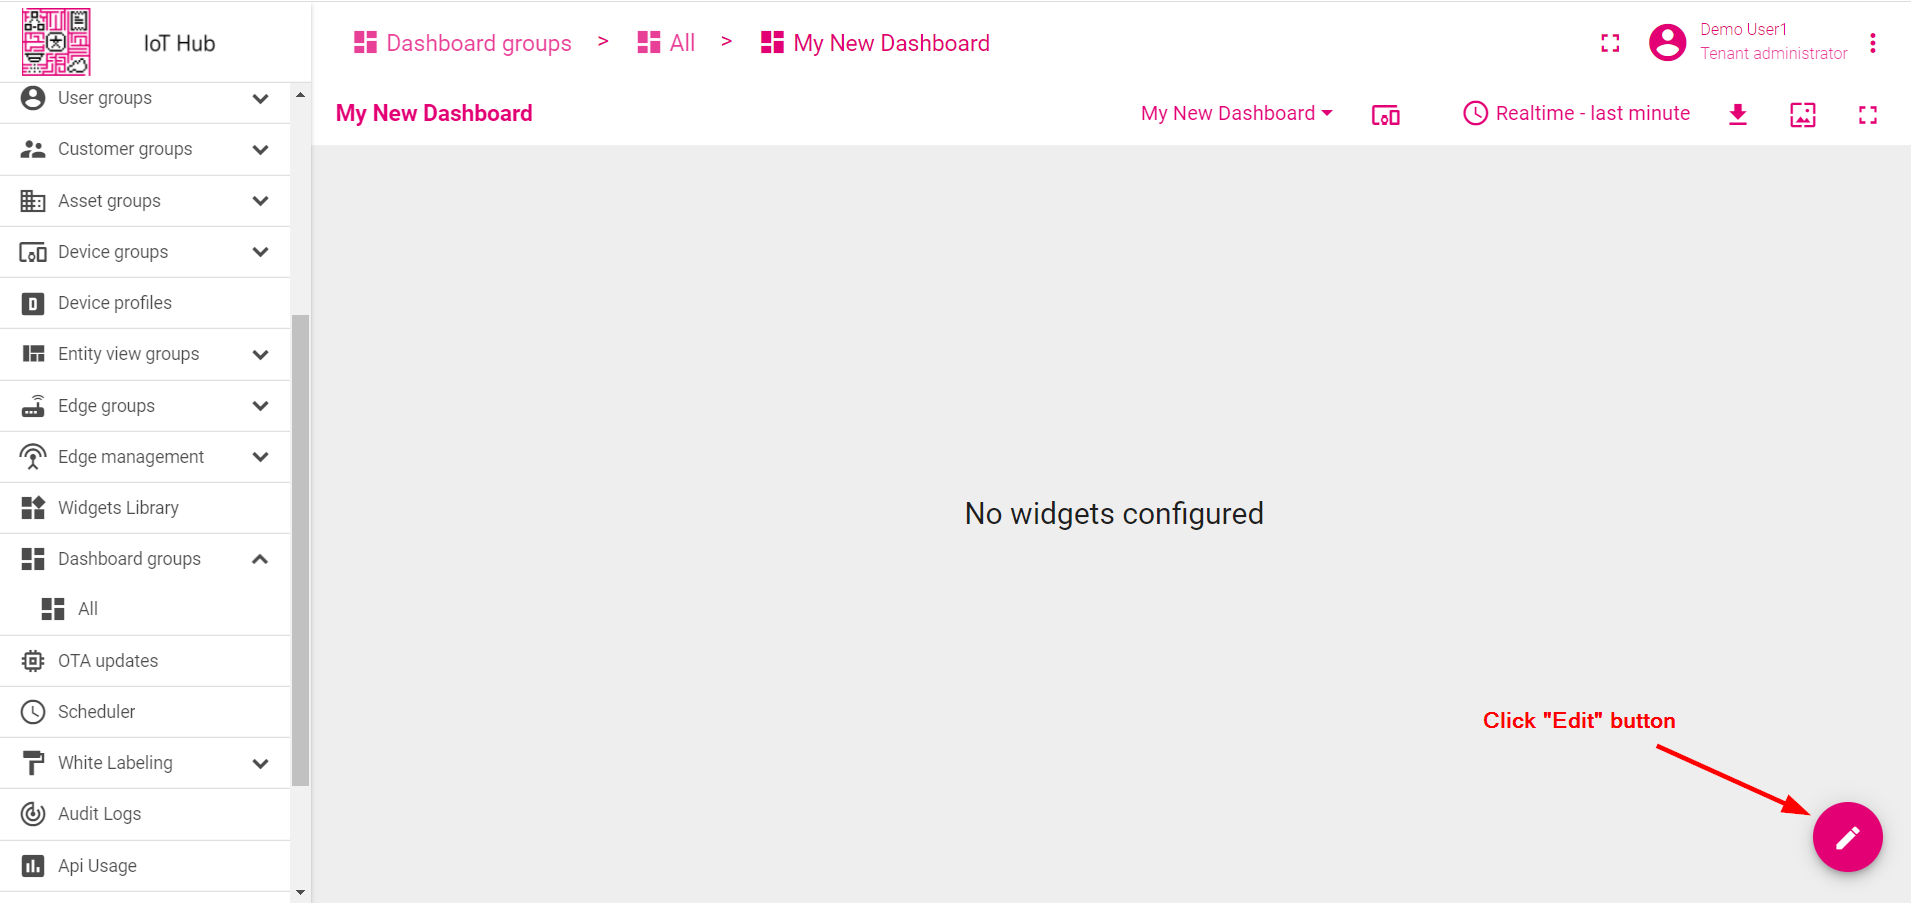
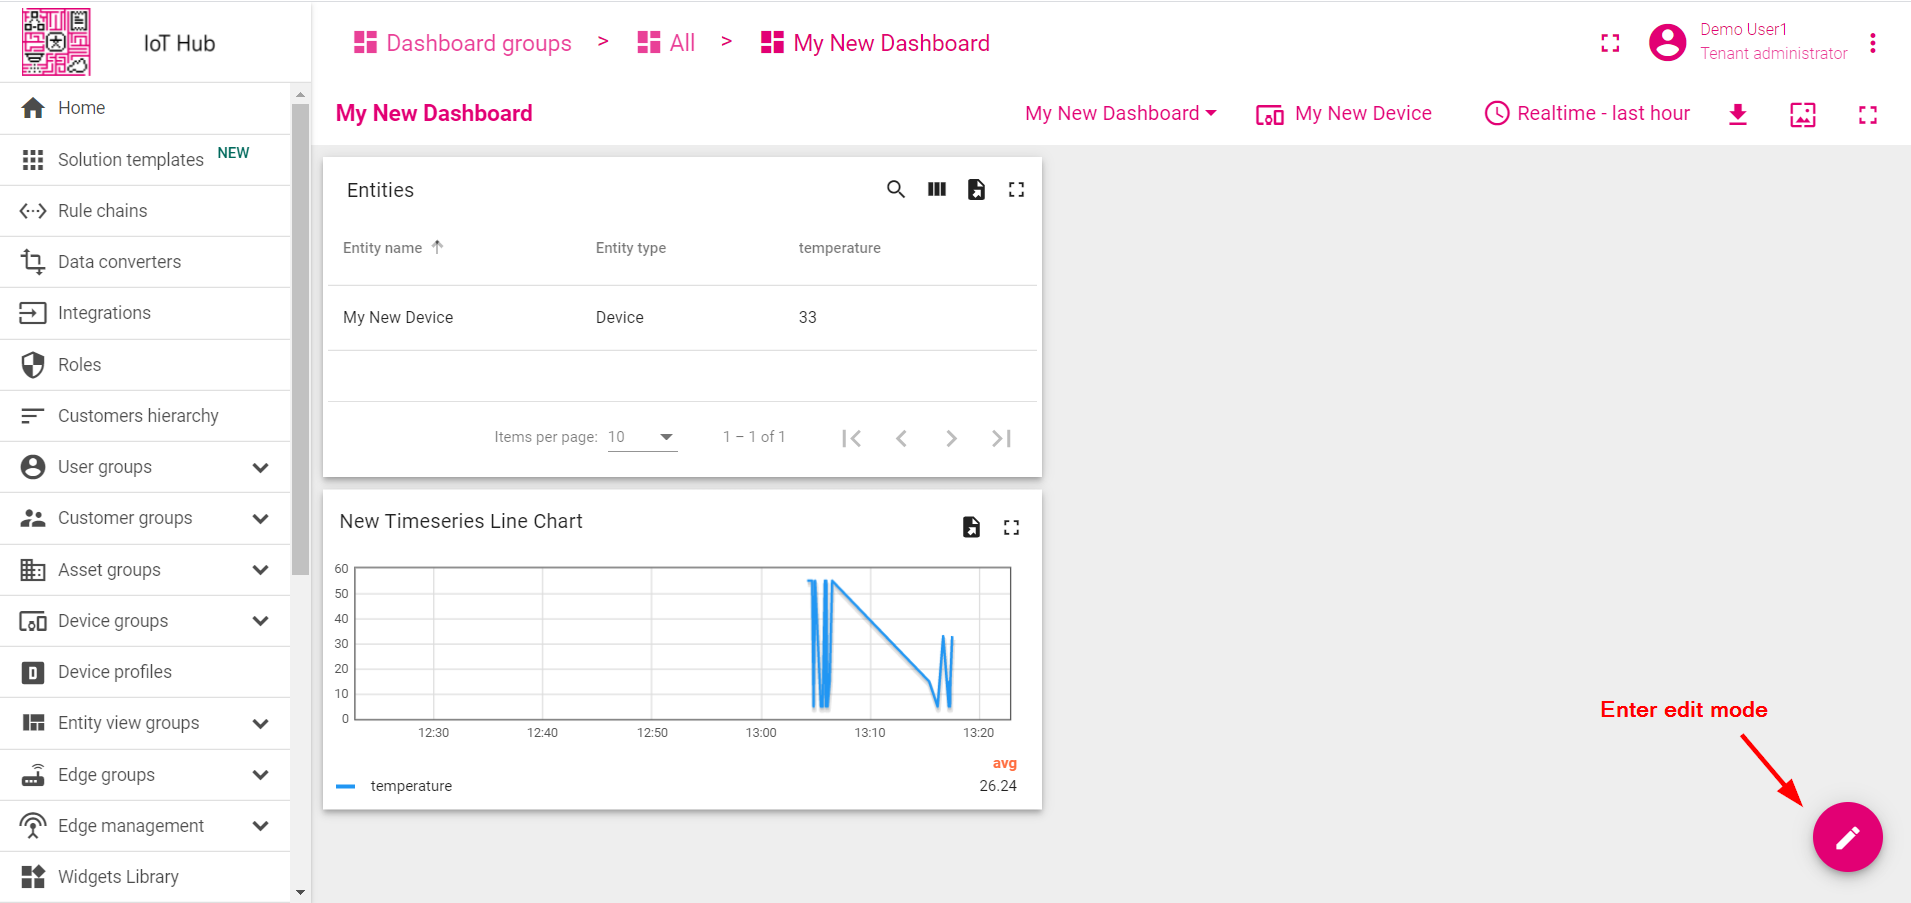
- Enter edit mode. Click on the pencil button in the bottom right corner.
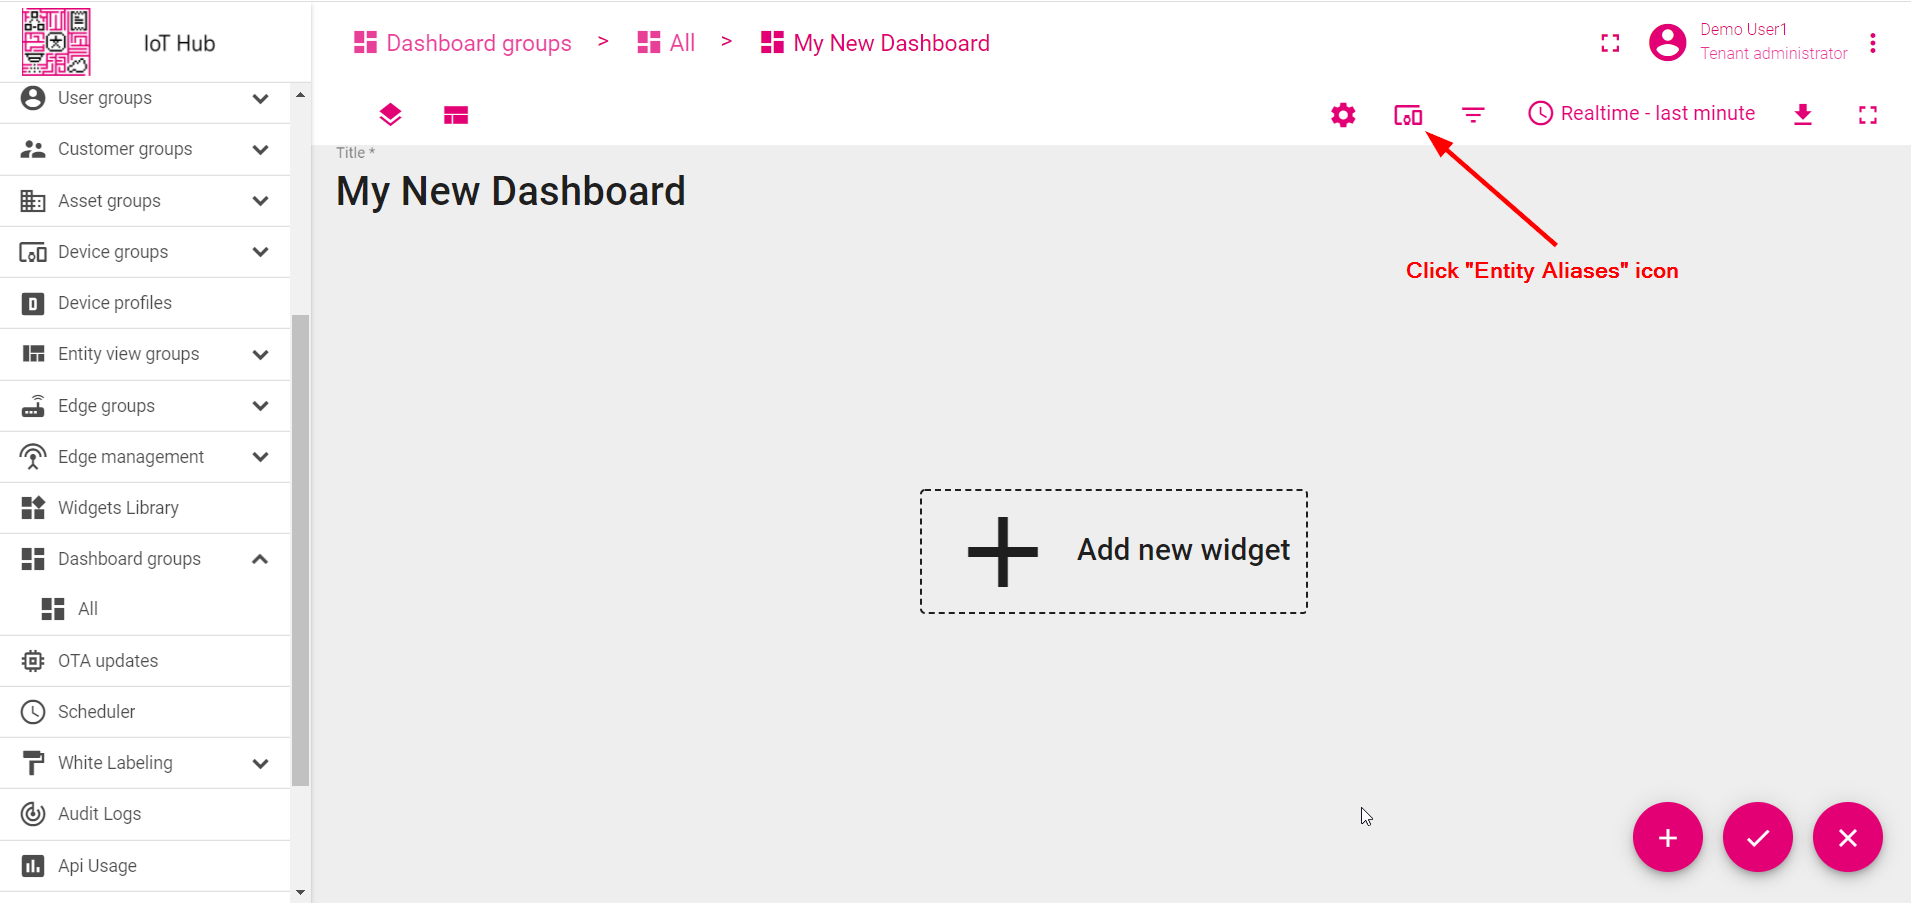
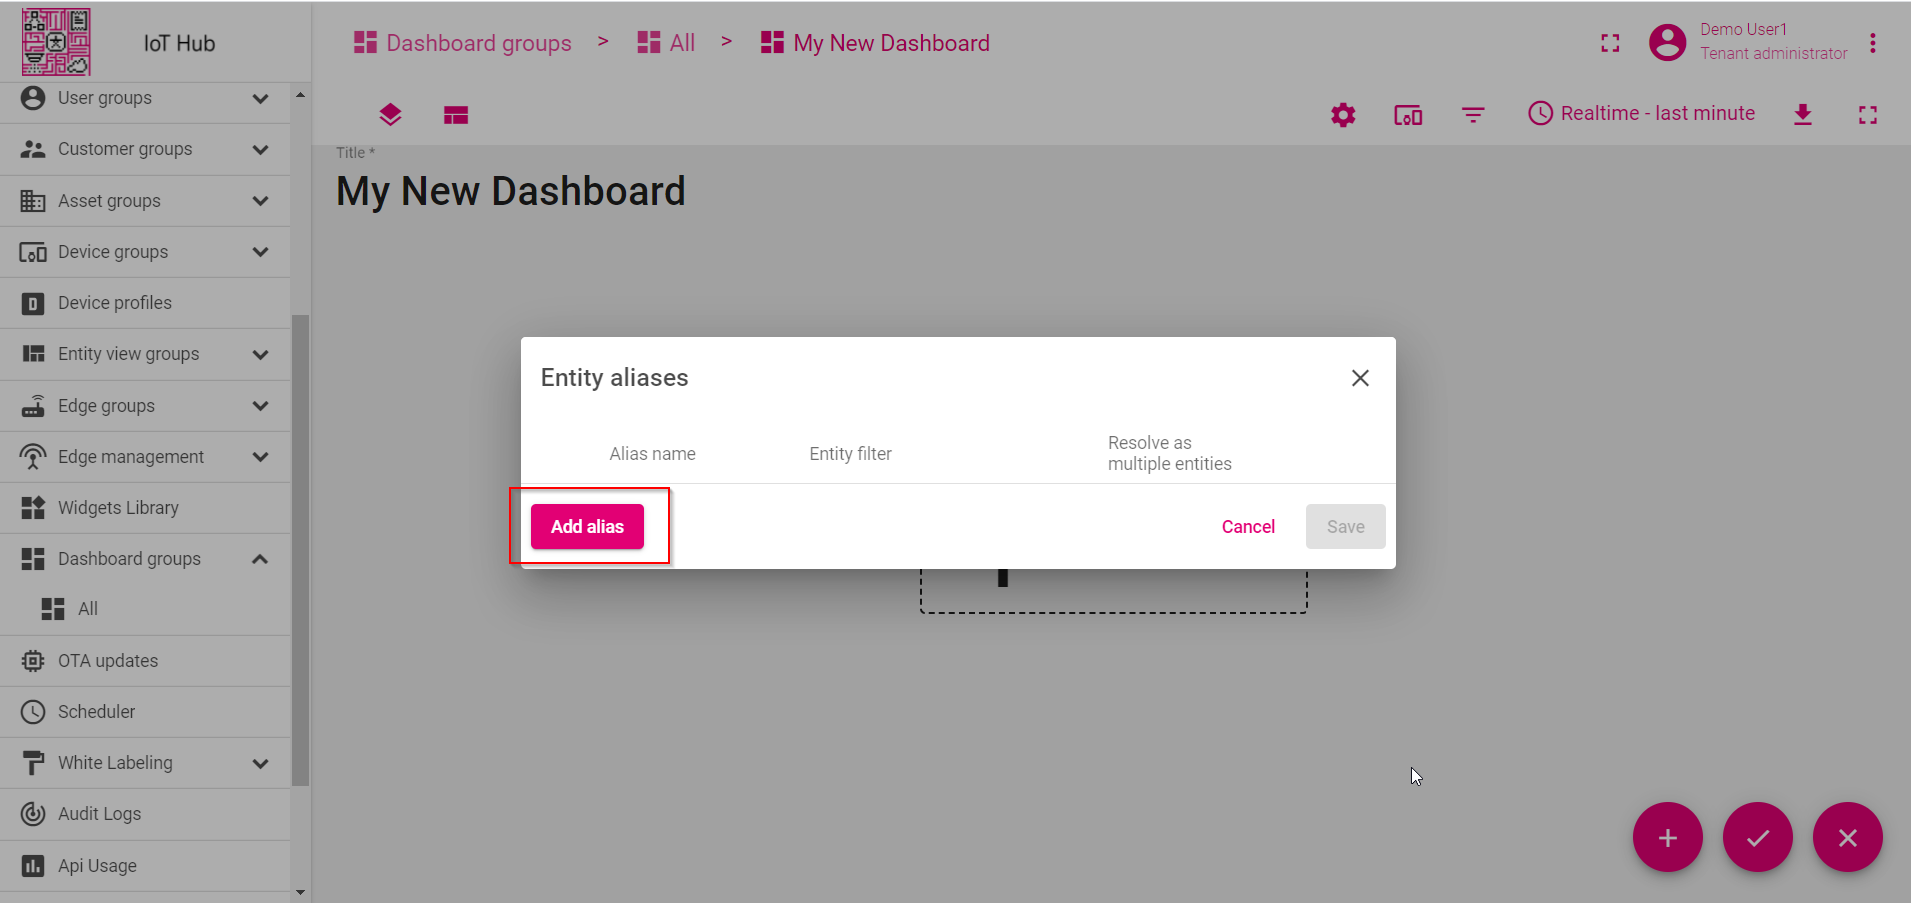
- Click "Entity Aliases" icon in the top right part of the screen. You will see an empty list of Entity aliases.
- Click "Add alias".
- Input alias name, for example "MyDevice". Select "Single entity" Filter type. Select "Device" as Type and type "My New" to enable autocomplete. Choose your device from the auto-complete and click on the needed device.
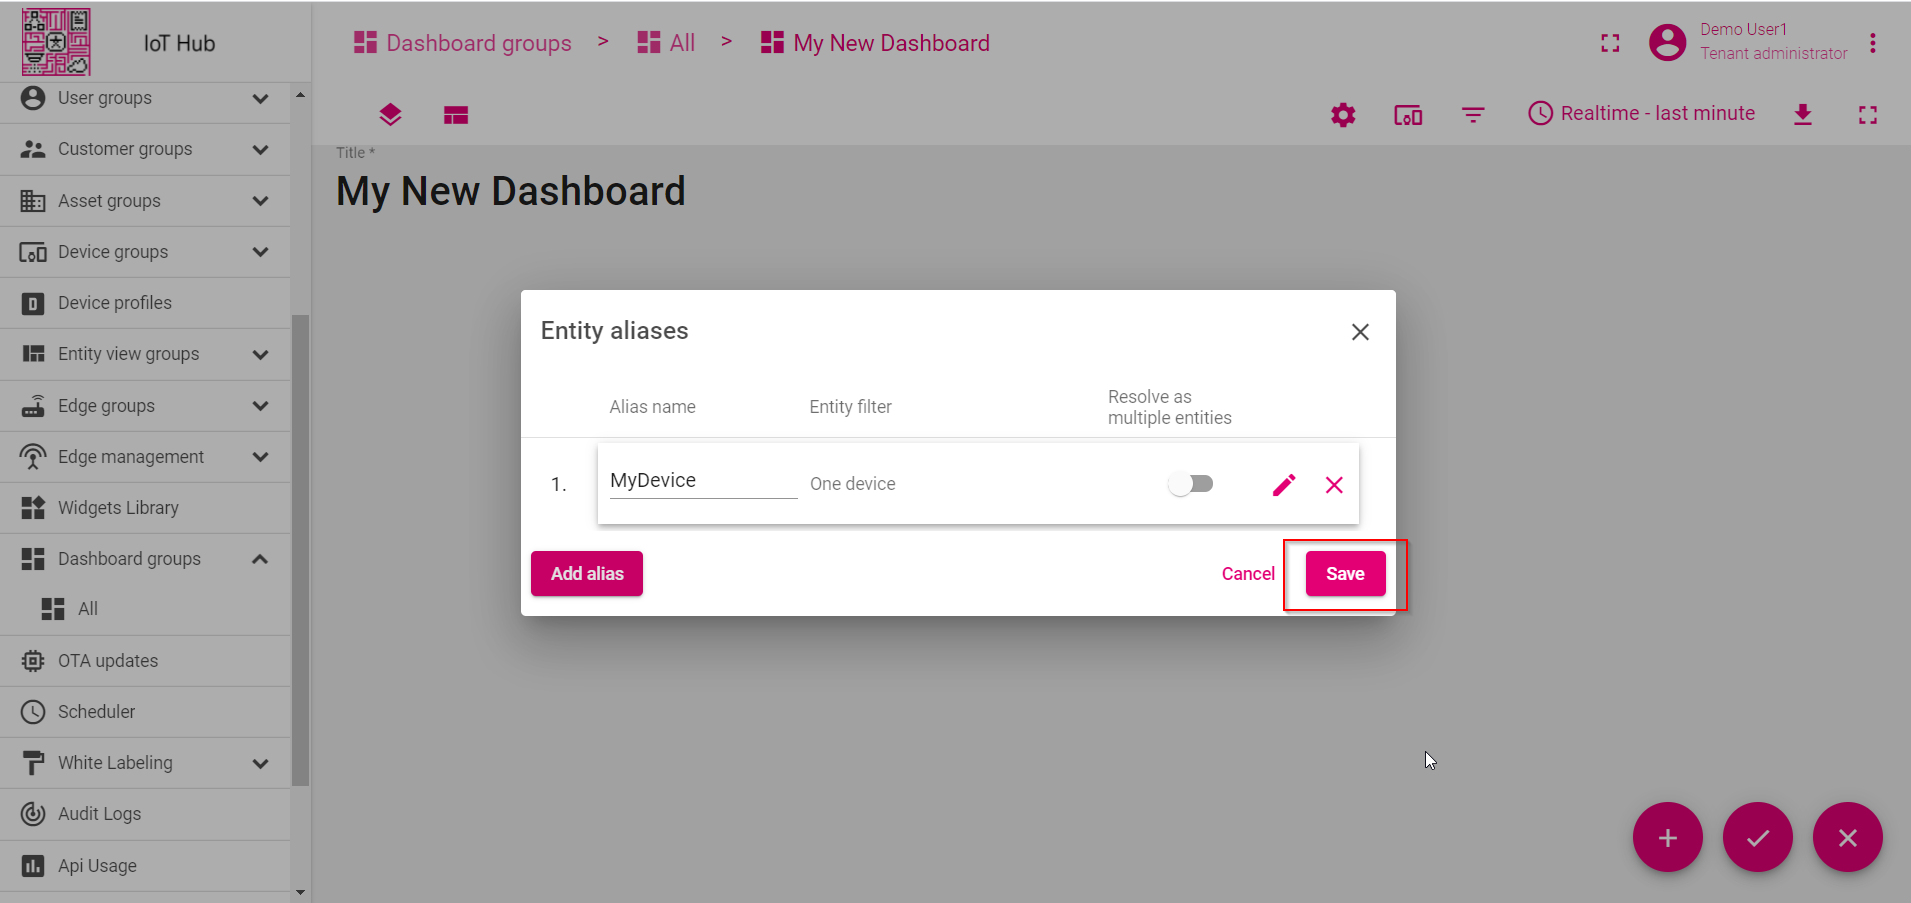
- Click "Add" and then "Save".
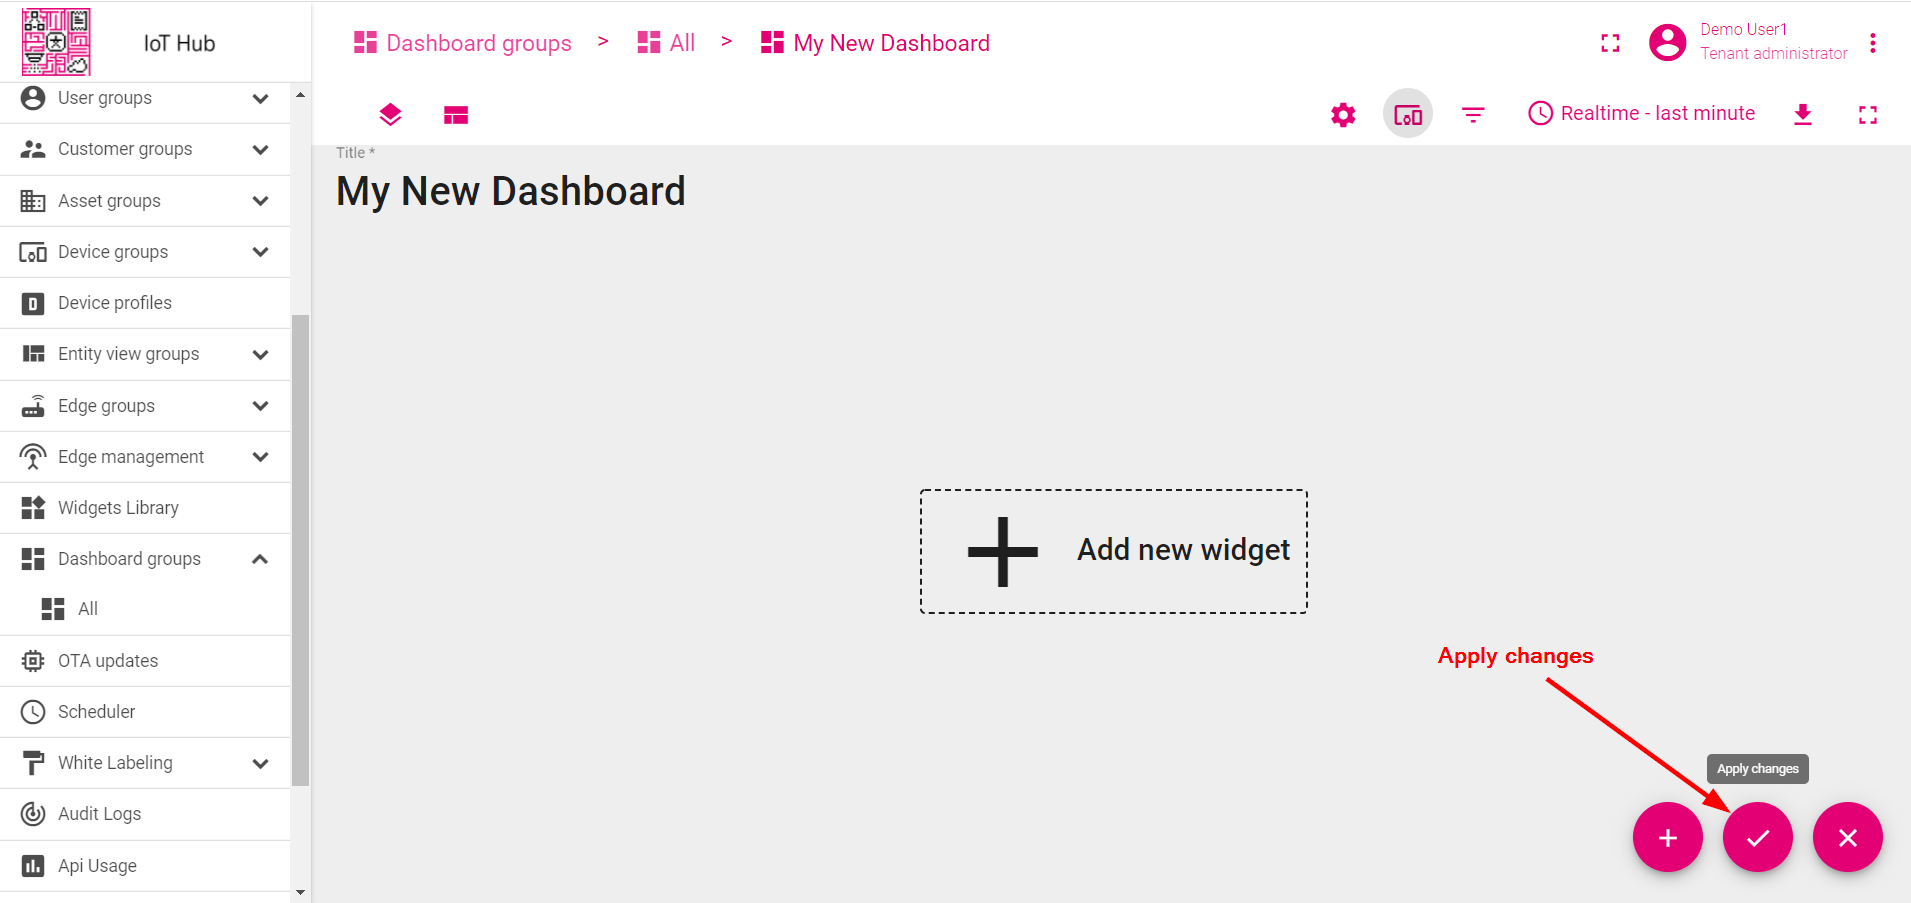
- Finally, Click "Apply changes" in the dashboard editor to save the changes. Then you should enter edit mode again.
Step 3.3 Add table widget
To add the table widget we need to select it from the widget library. Widgets are grouped into widget bundles. Each widget has a data source. This is how the widget “knows” what data to display. To see the latest value of our “temperature” data that we sent during step 2, we should configure the data source.
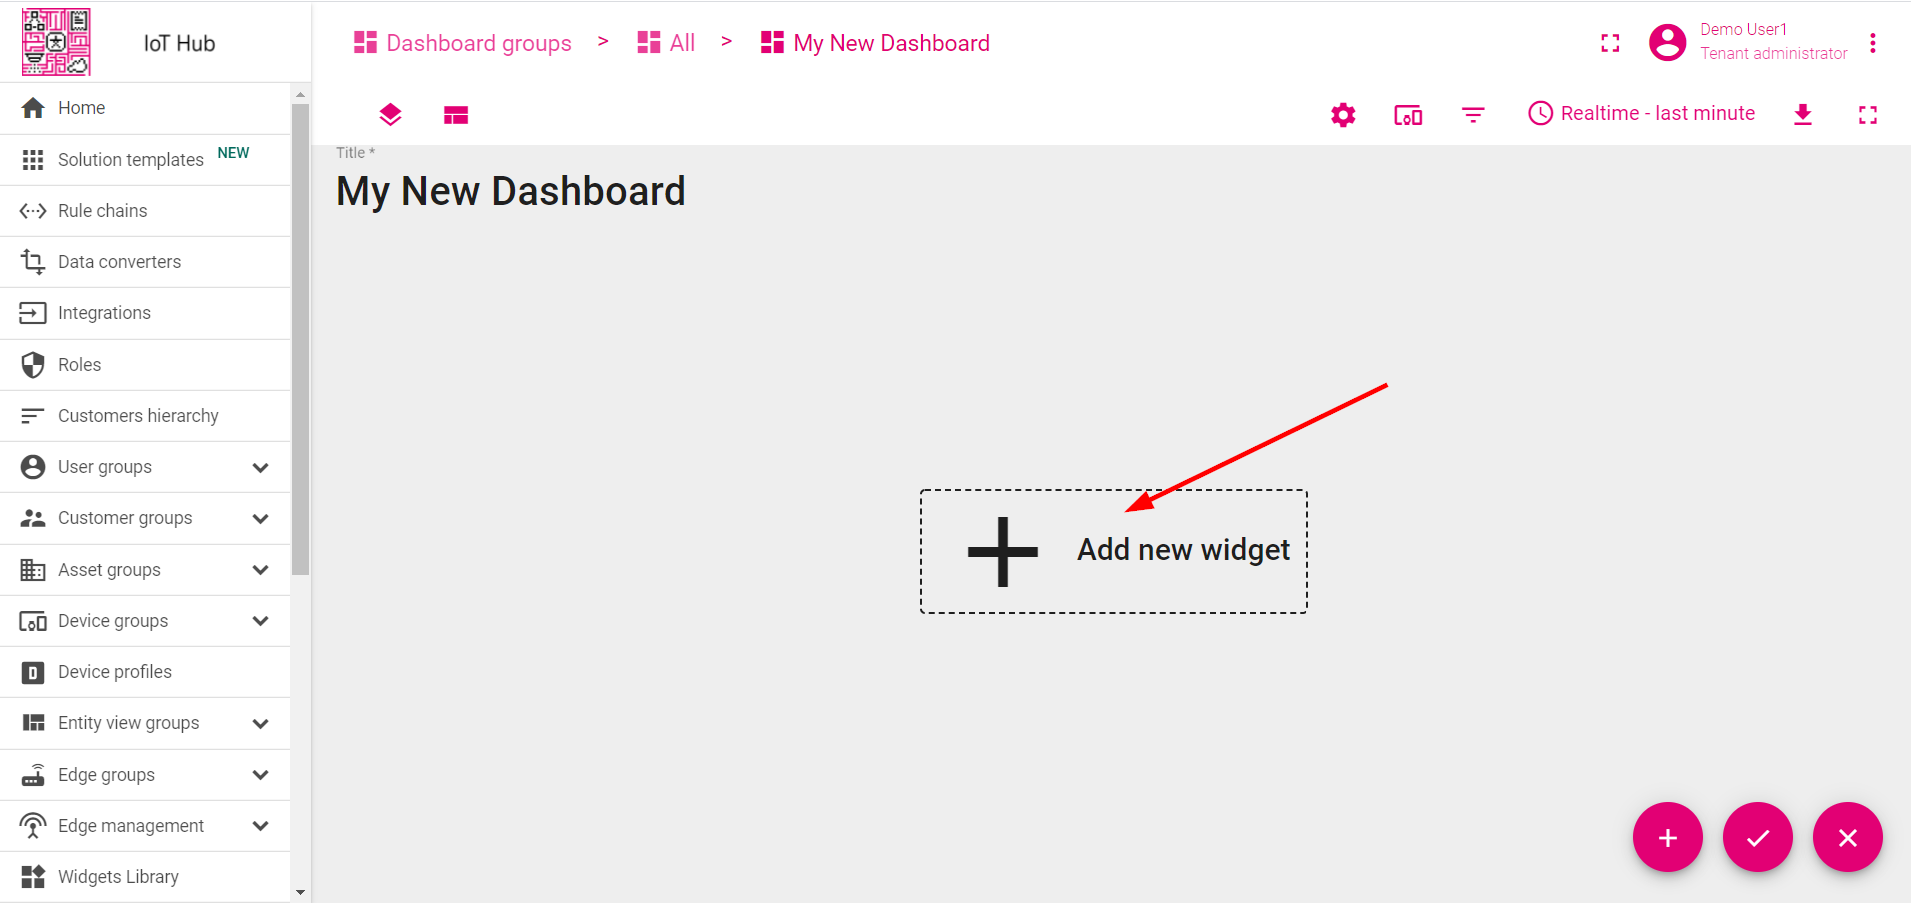
- Enter edit mode. Click on the "Add new widget" button.
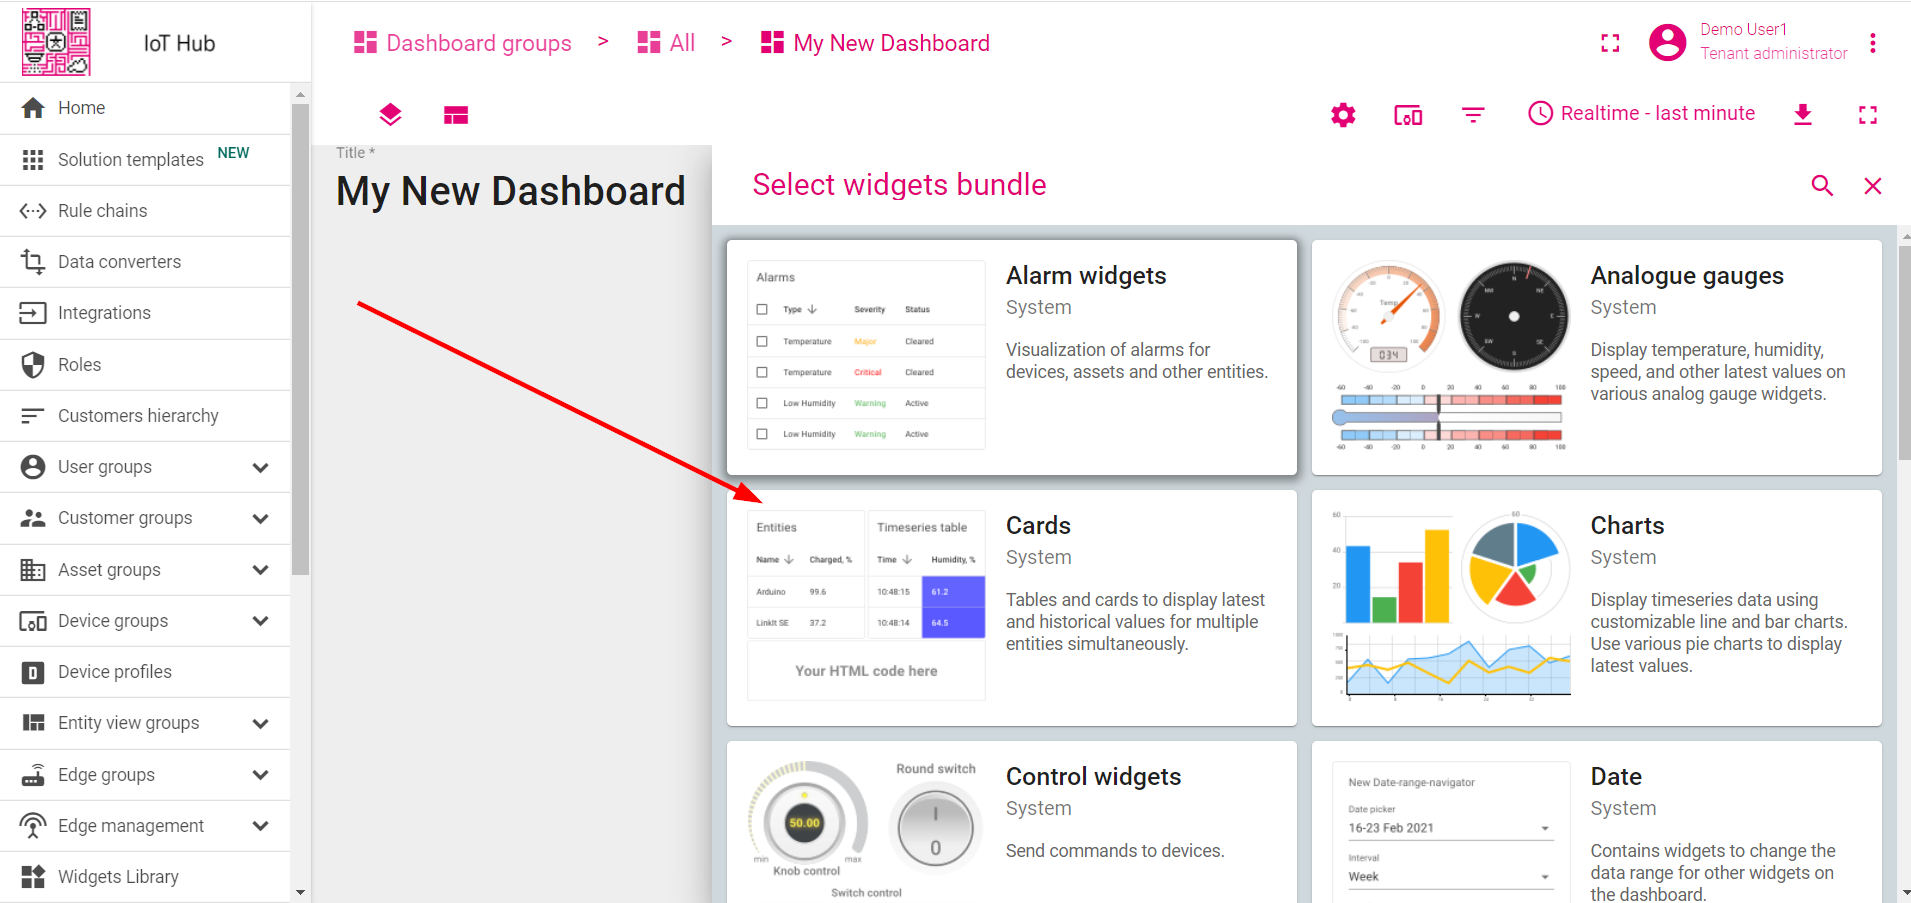
- Select "Cards" widget bundle.
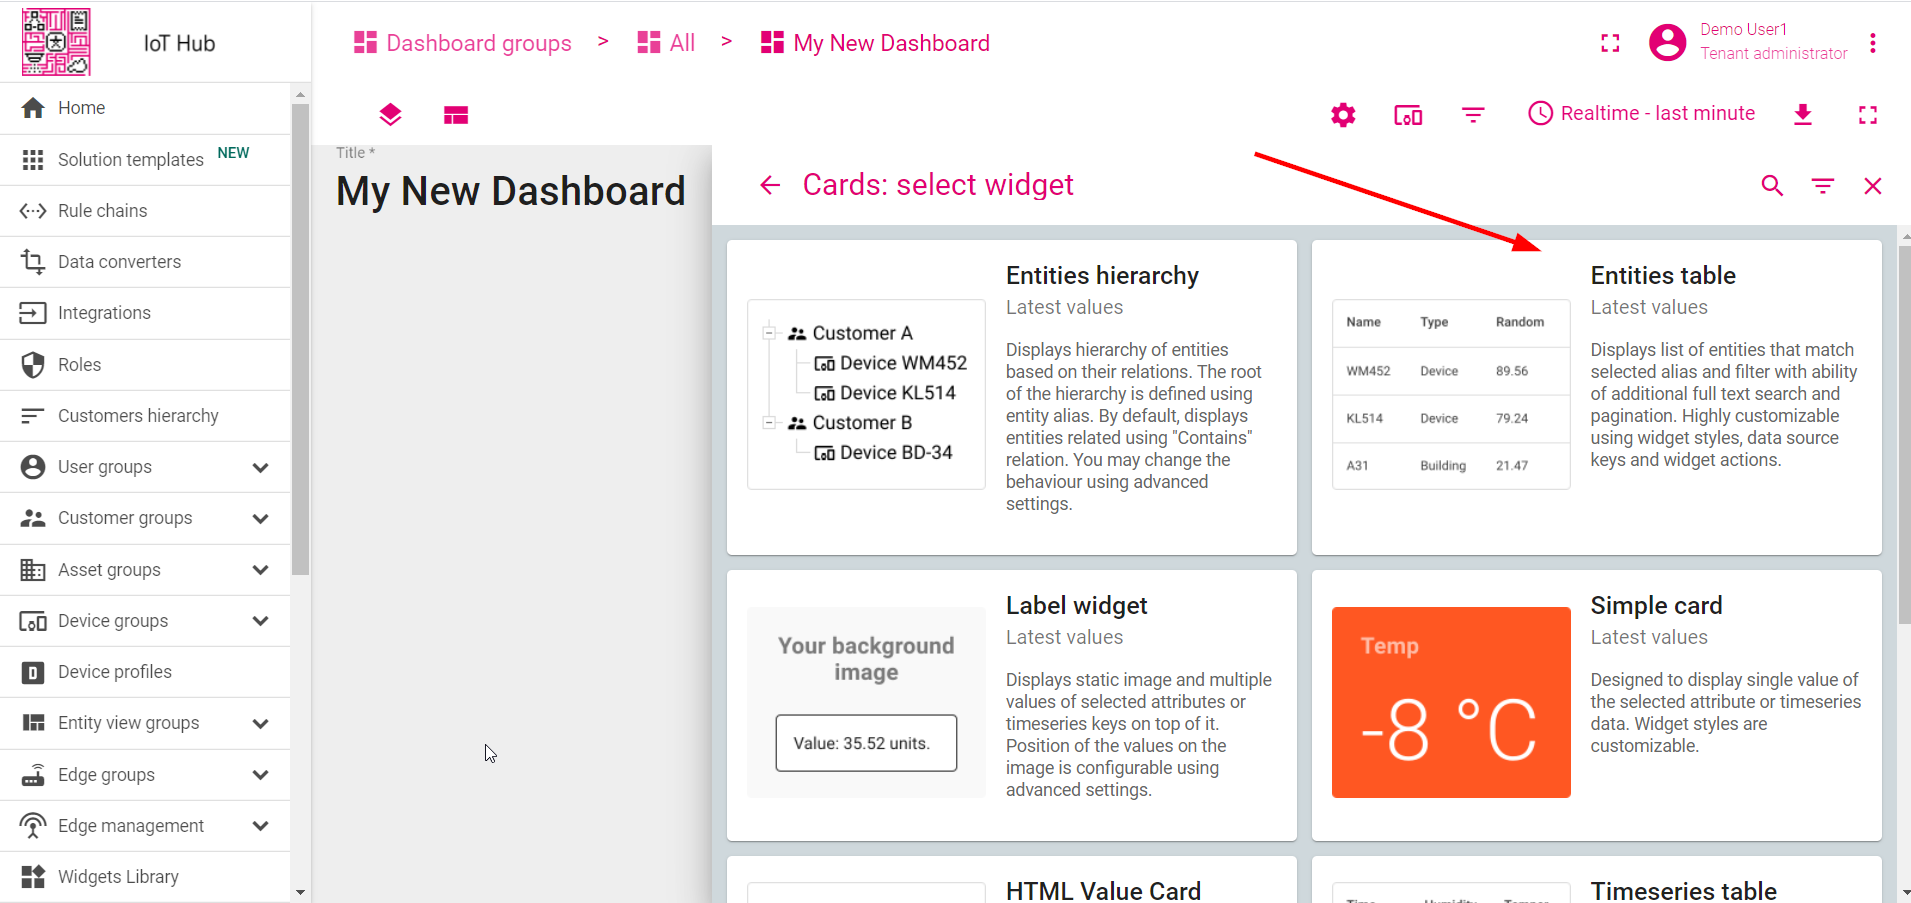
- Select "Entities table - Latest values" widget.
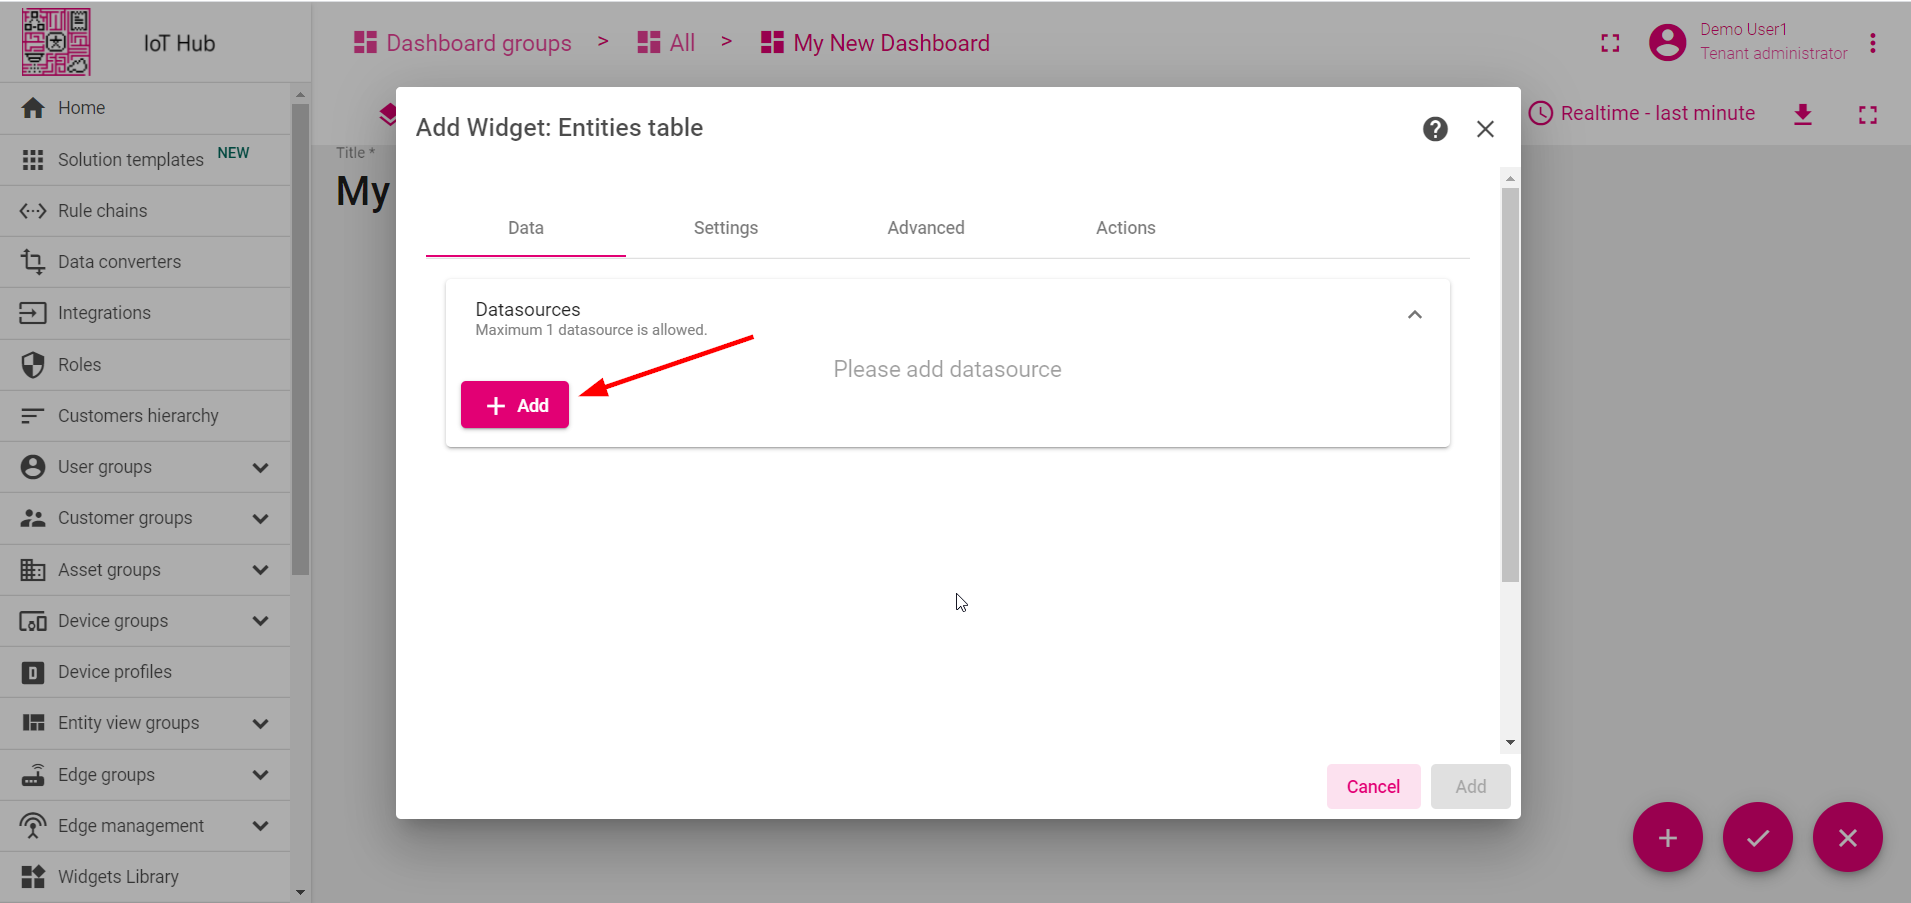
- Click "Add" to add the data source. Widget may have multiple data sources, but we will use only one in this case.
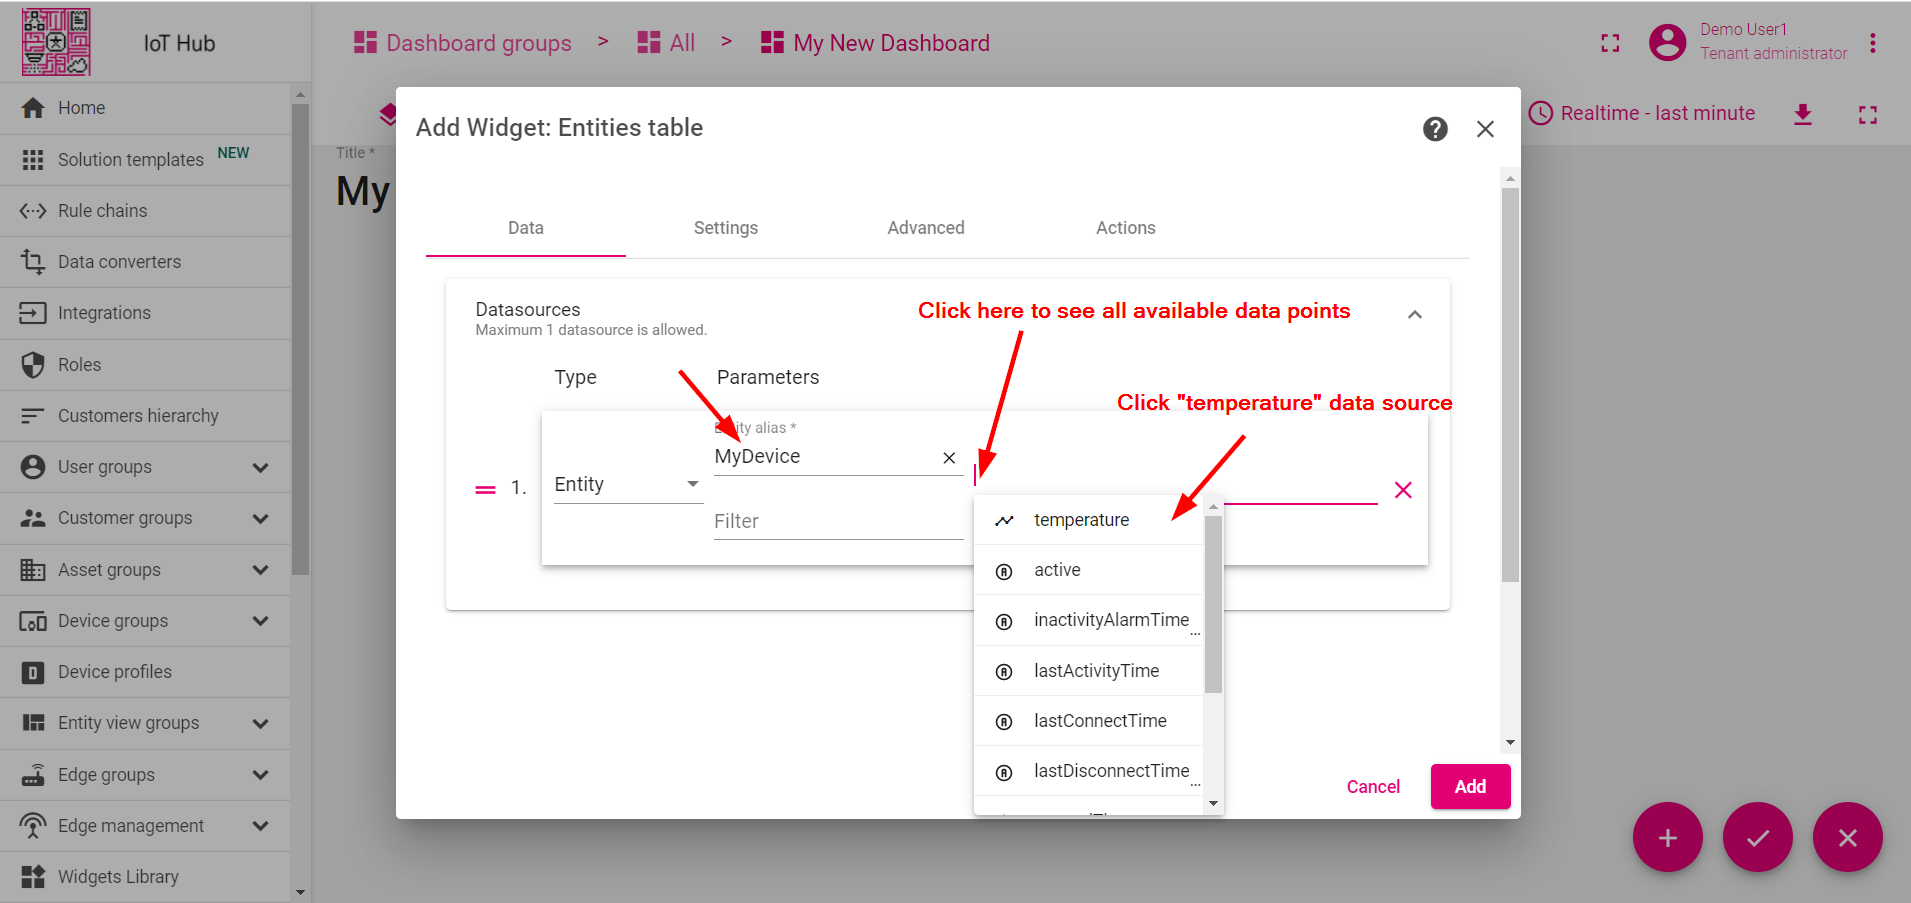
- Select "MyDevice" entity alias. Then click on the input field to the right. The auto-complete with available data points will appear. Select "temperature" data point and click "Add".
- Resize the widget to make it a little bigger. Just drag the bottom right corner of the widget. You can also play with the advanced settings if you want to edit the widget.
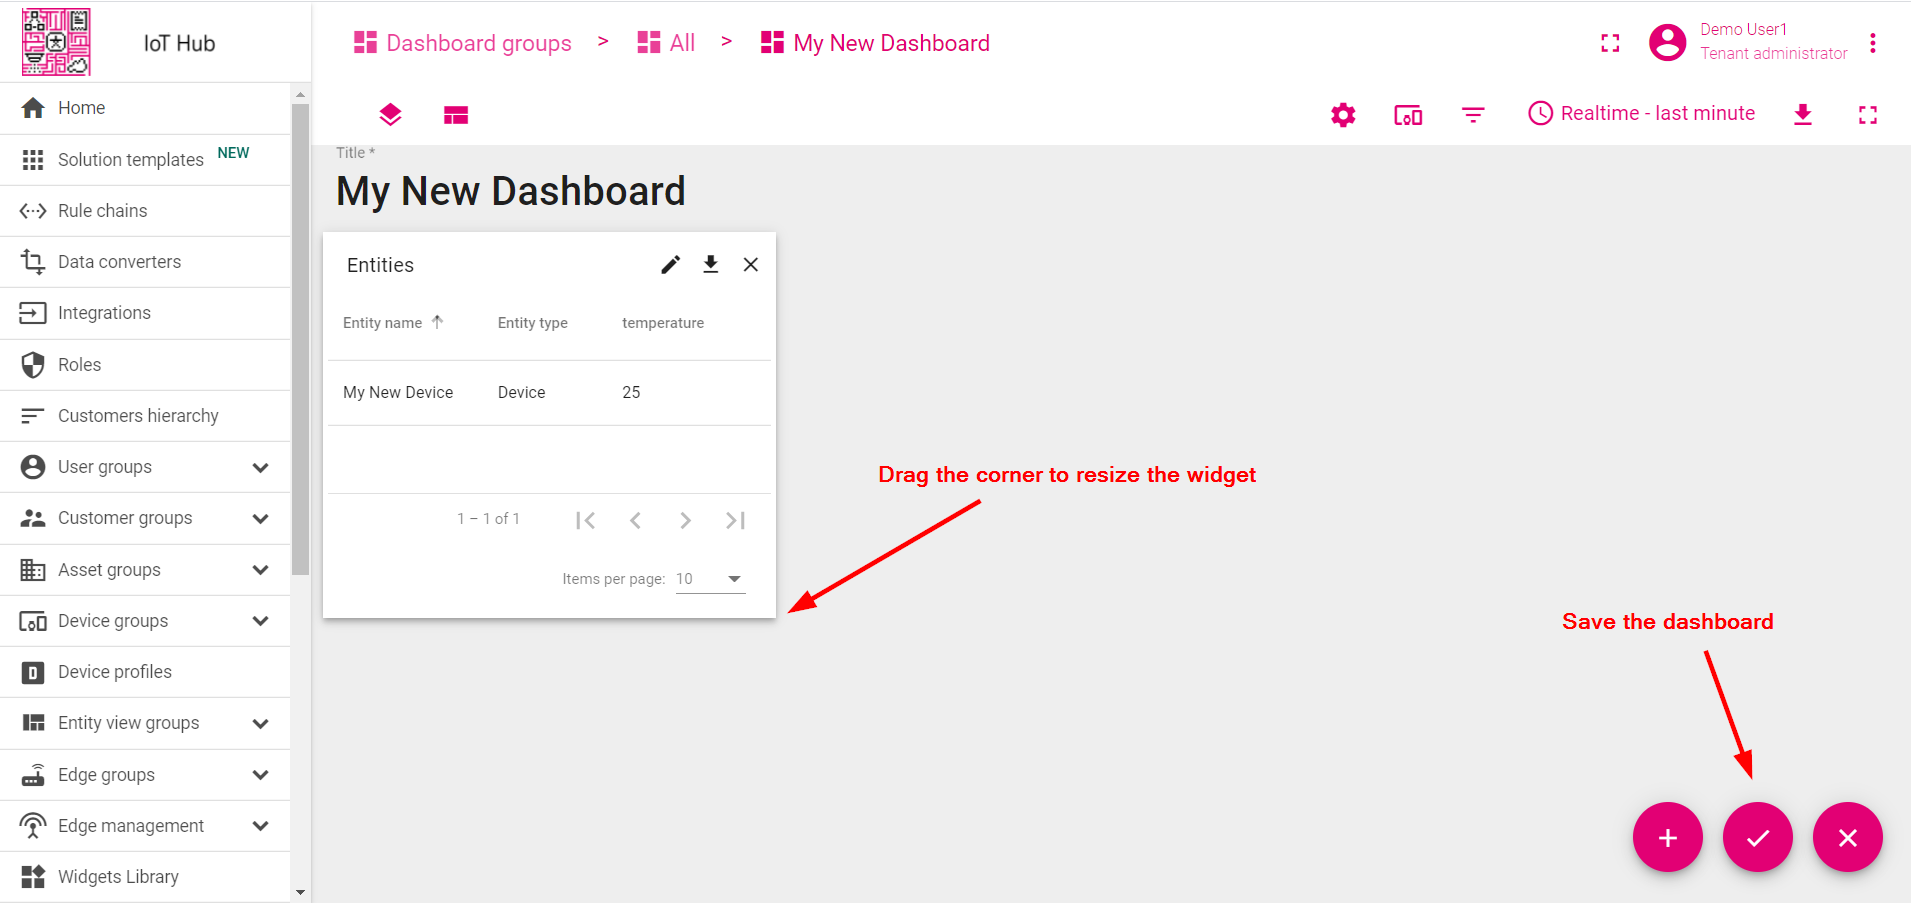
Congratulations! You have added the first widget. Now you are able to send a new telemetry reading and it will immediately appear in the table.
Step 3.4 Add chart widget
To add the chart widget we need to select it from the widget library. Chart widget displays multiple historical values of the same data key (“temperature” in our case). We should also configure the time window to use the chart widget.
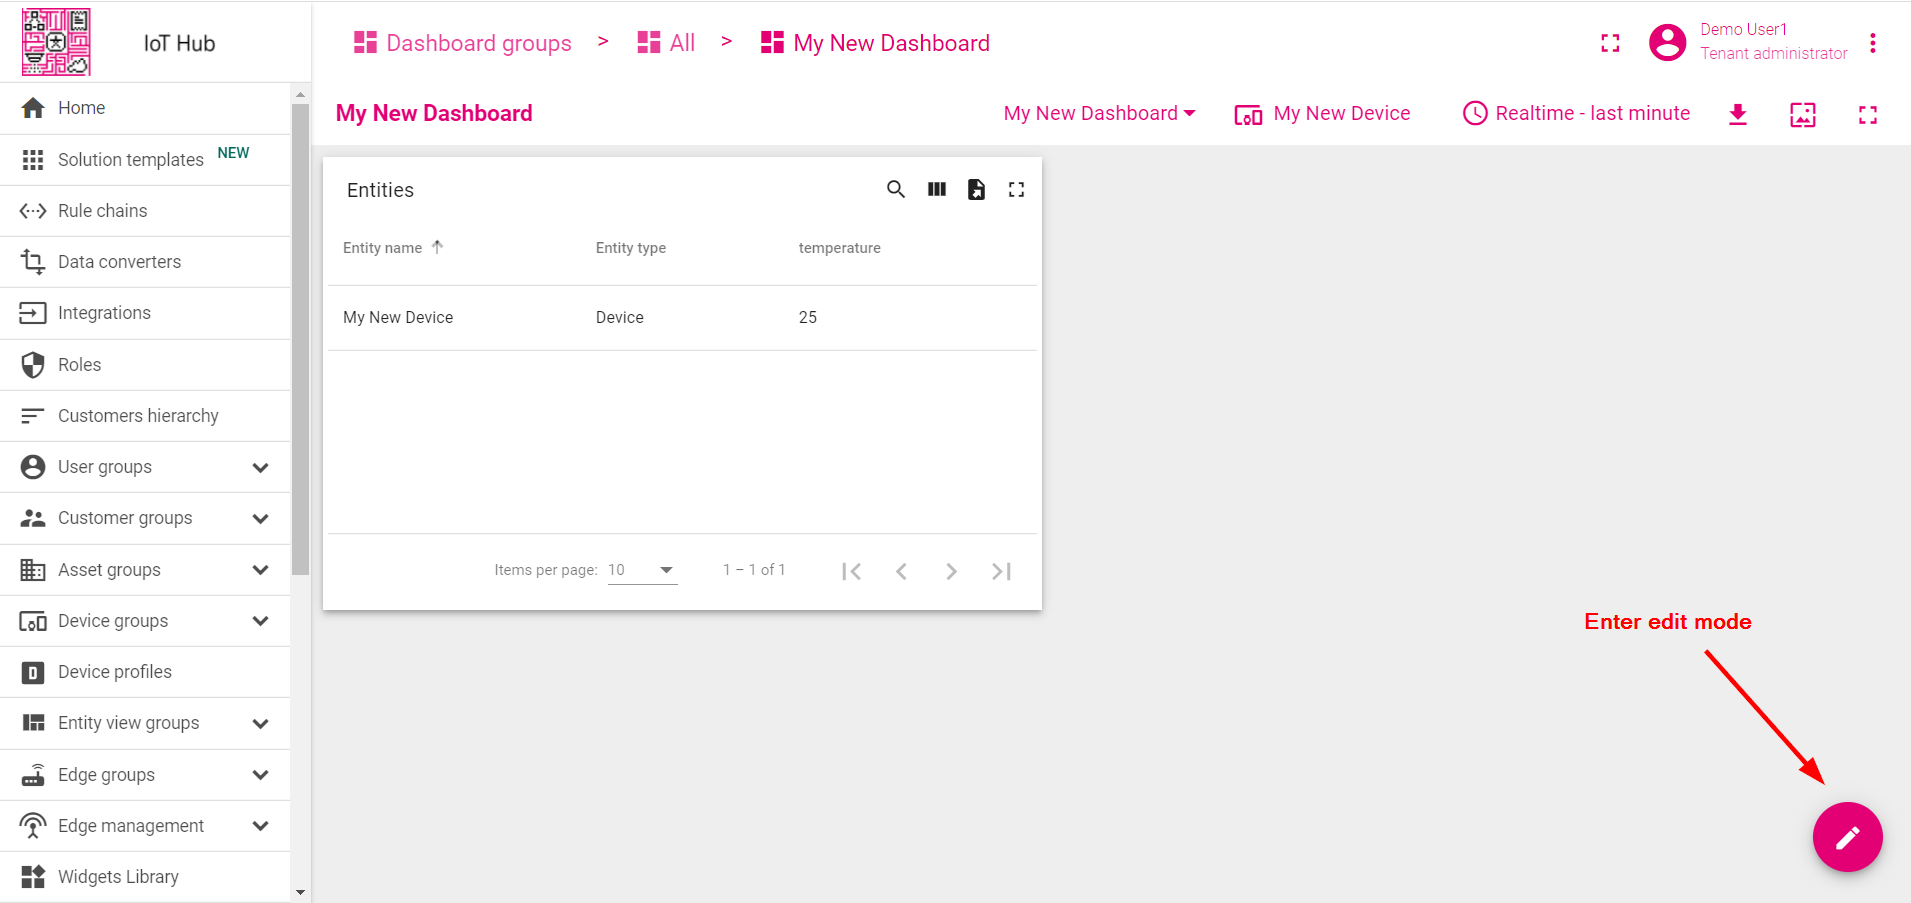
- Enter Edit mode.
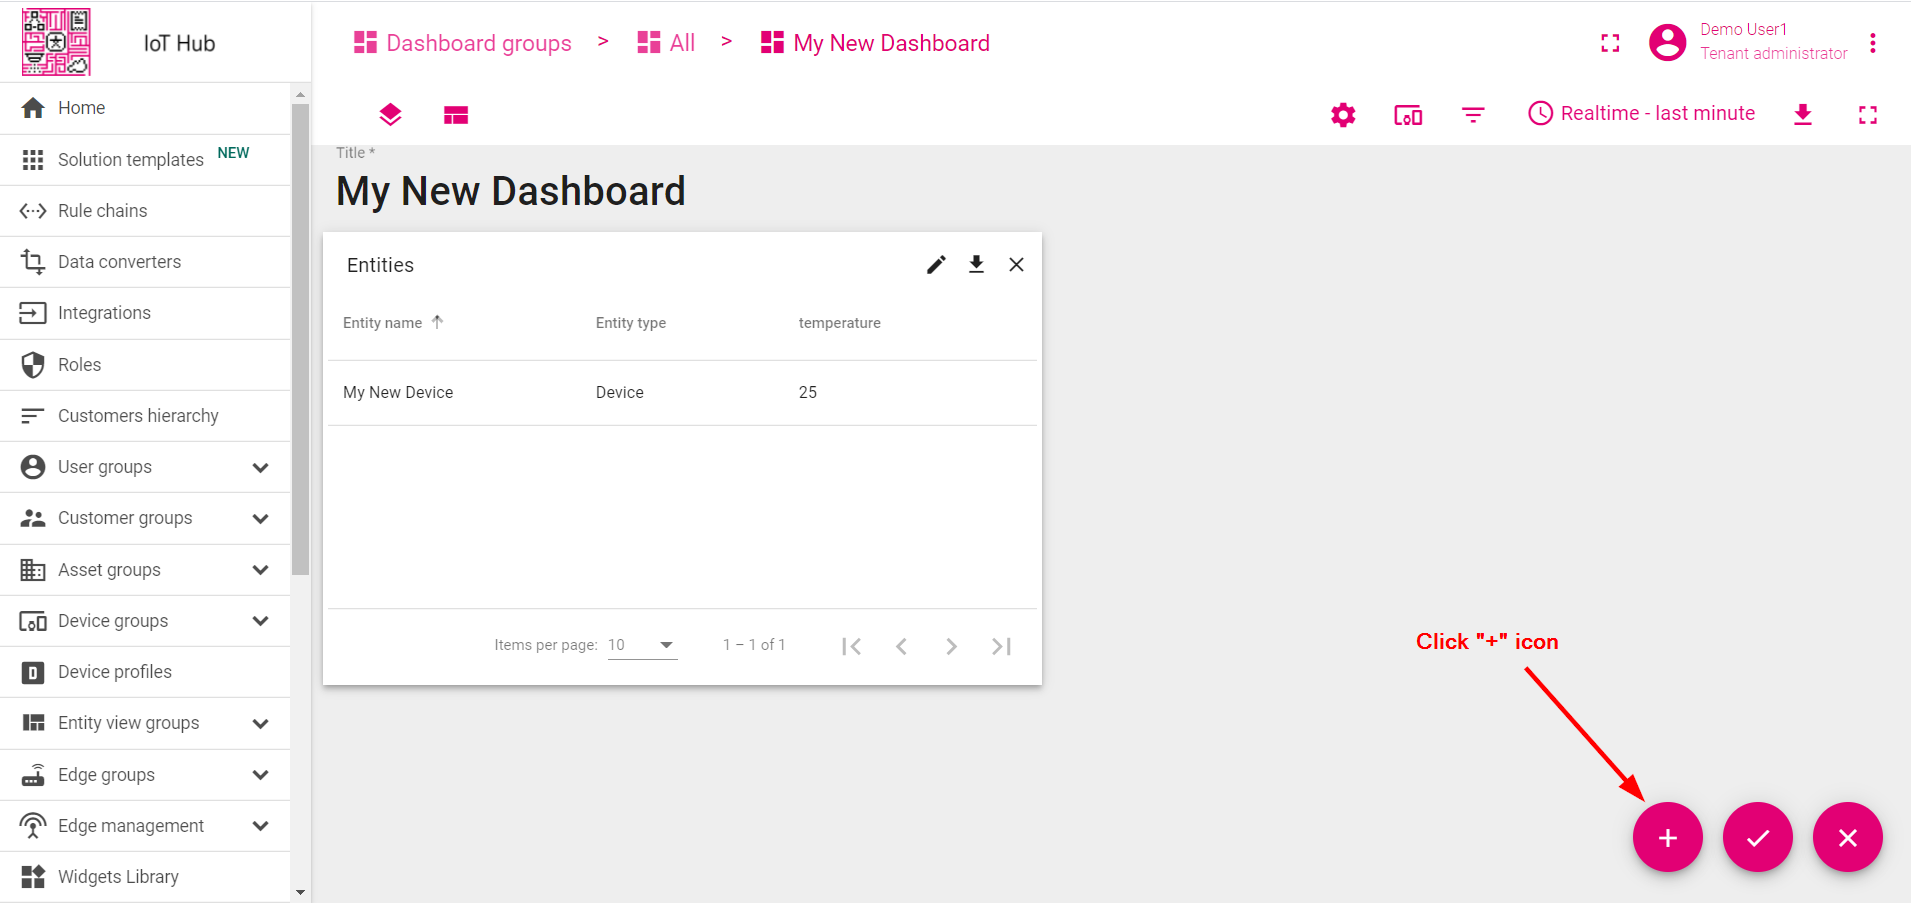
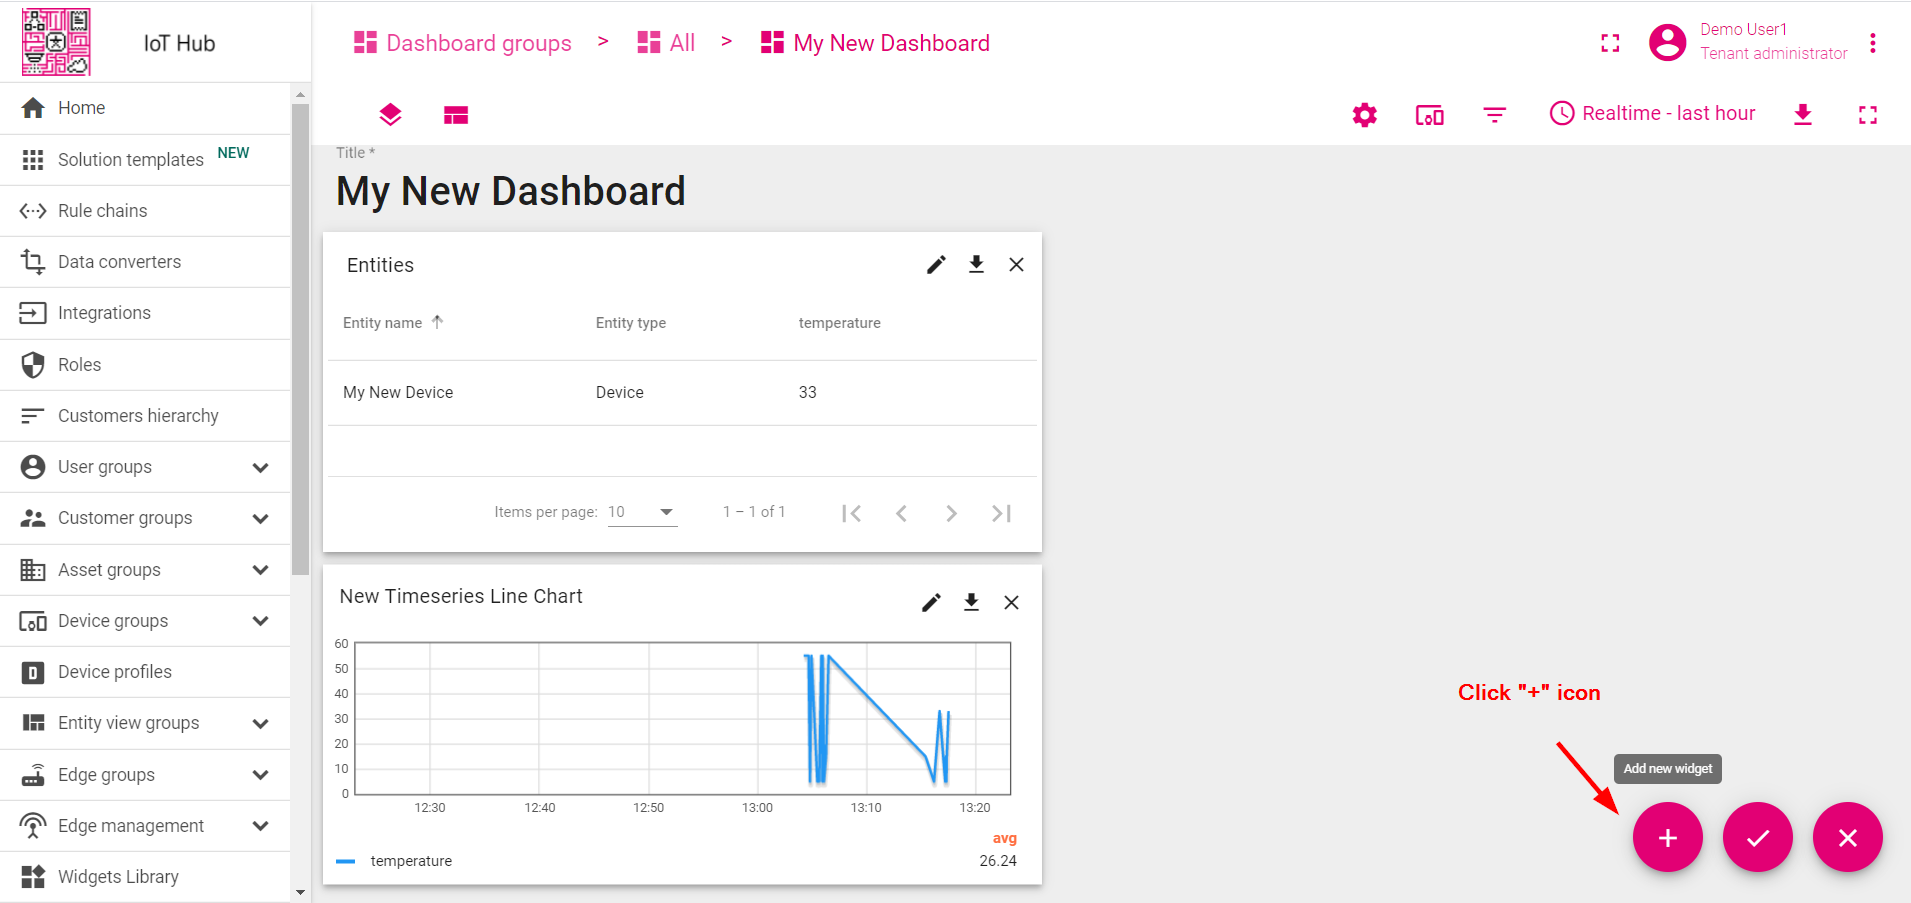
- Click "Add new widget" icon in the bottom right corner of the screen.
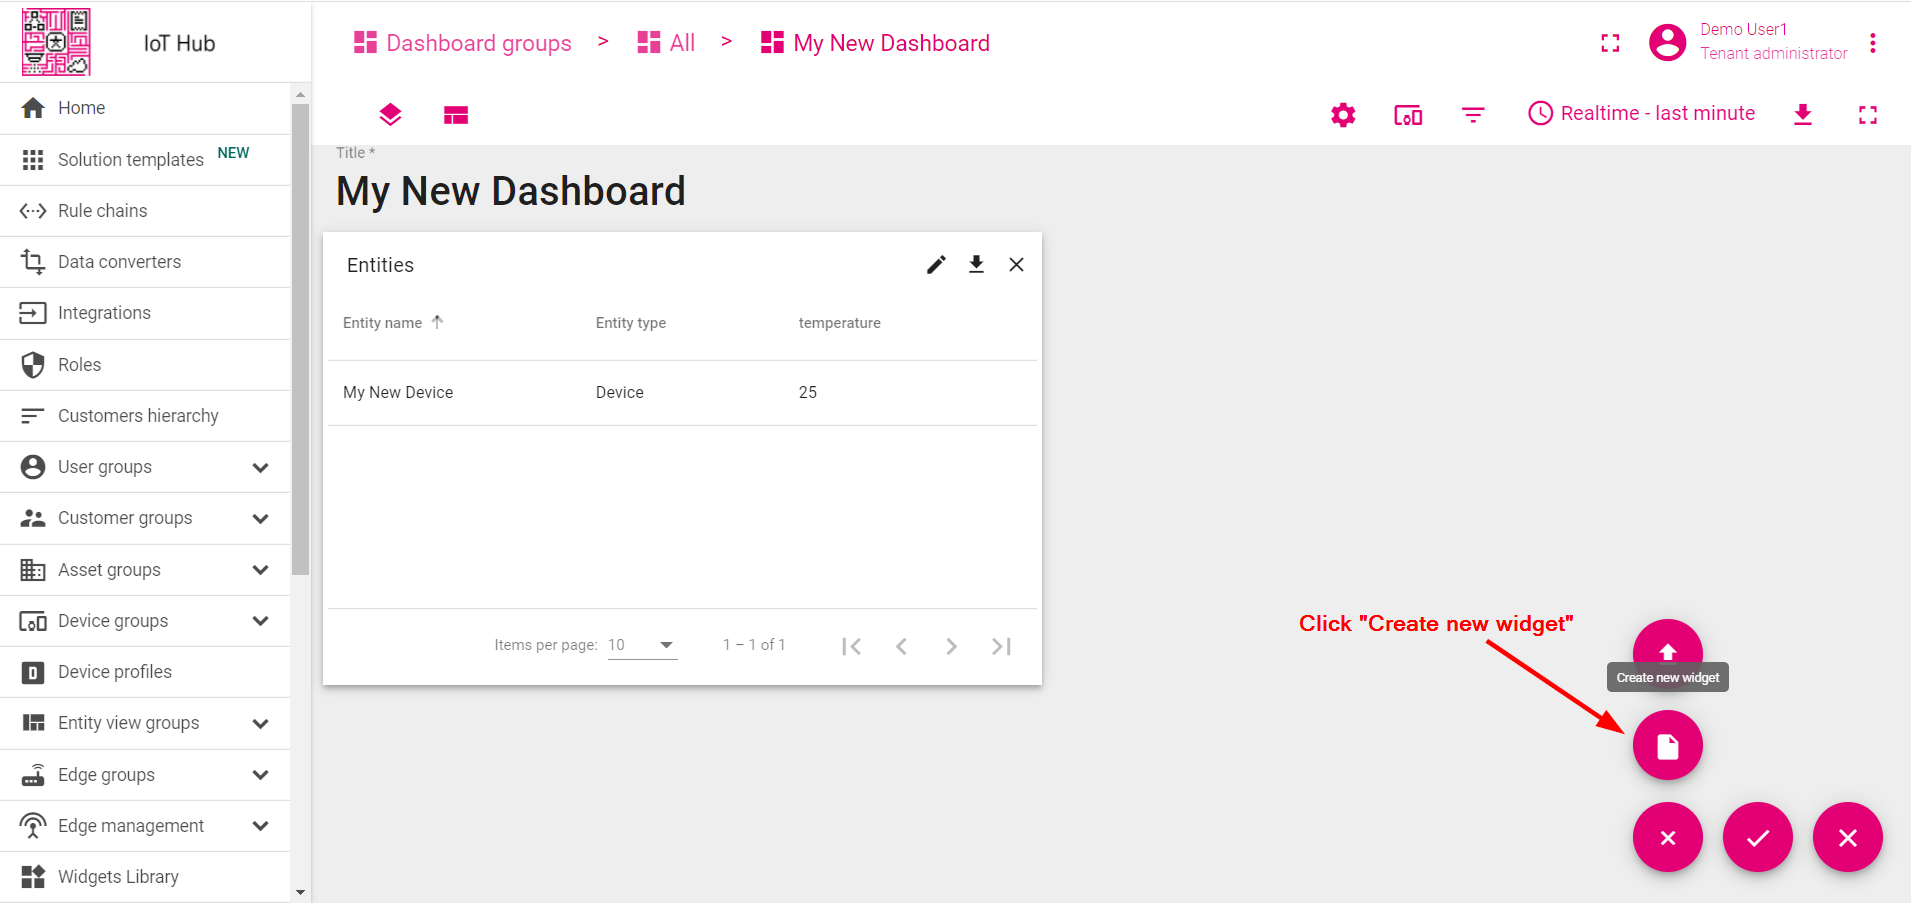
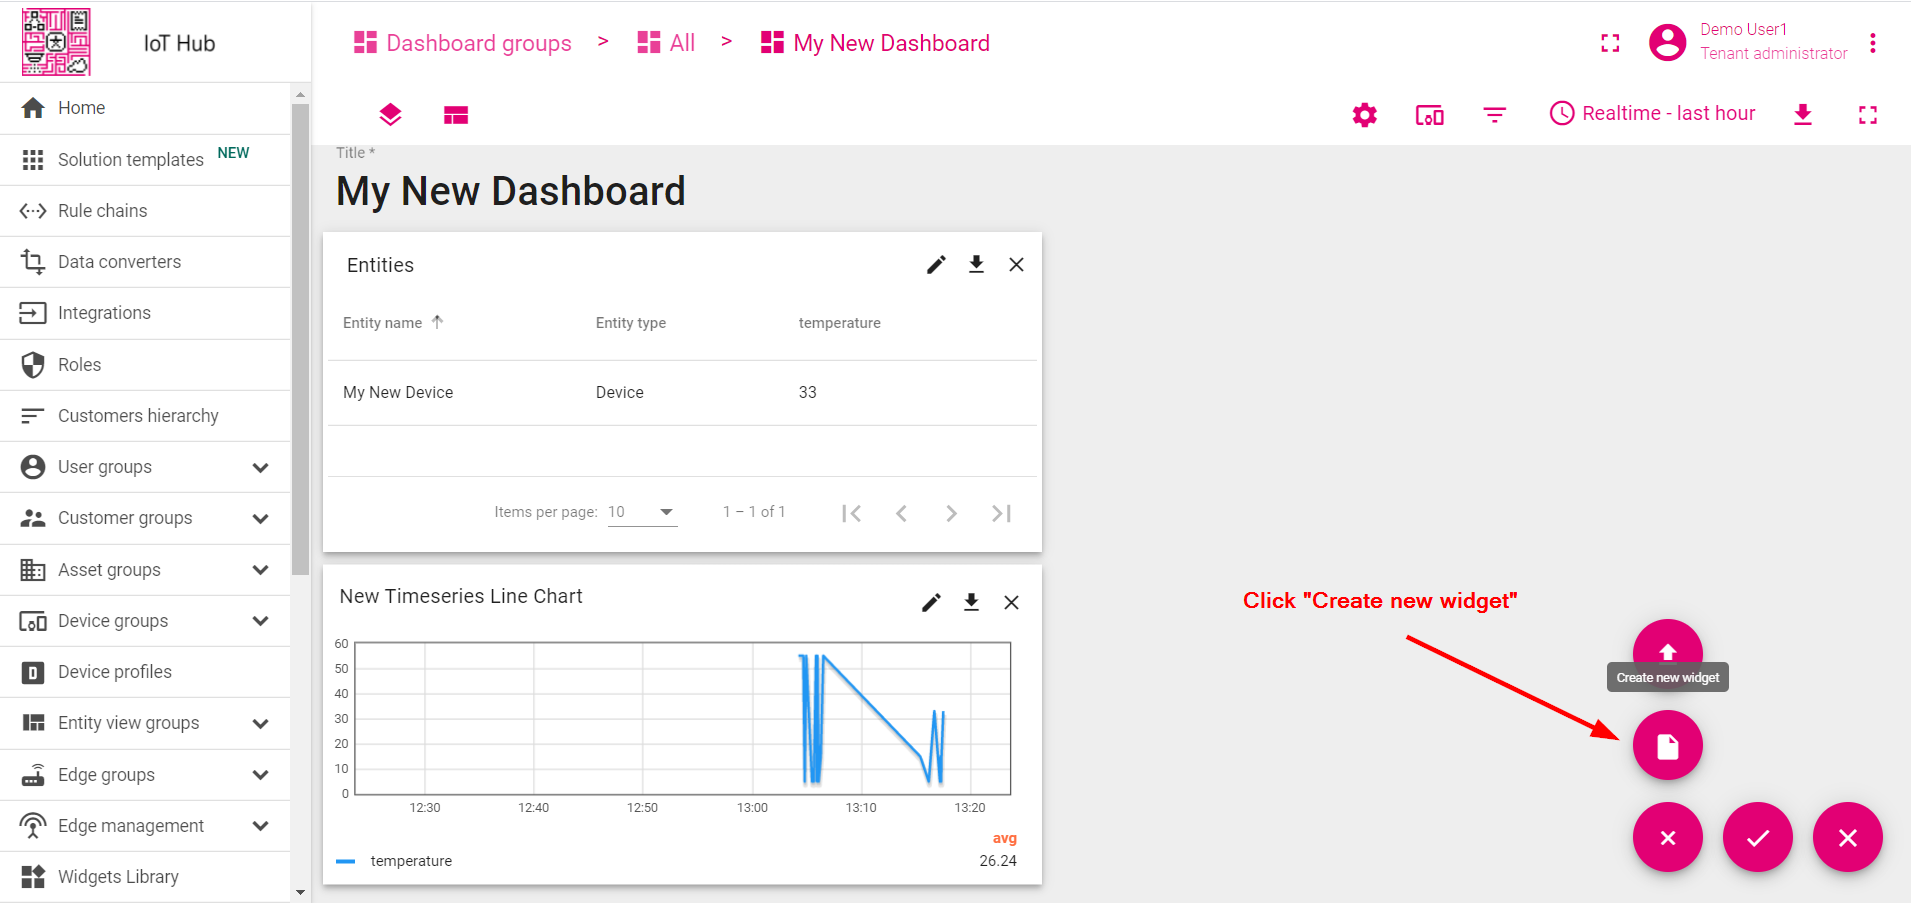
- Click "Create new widget" icon.
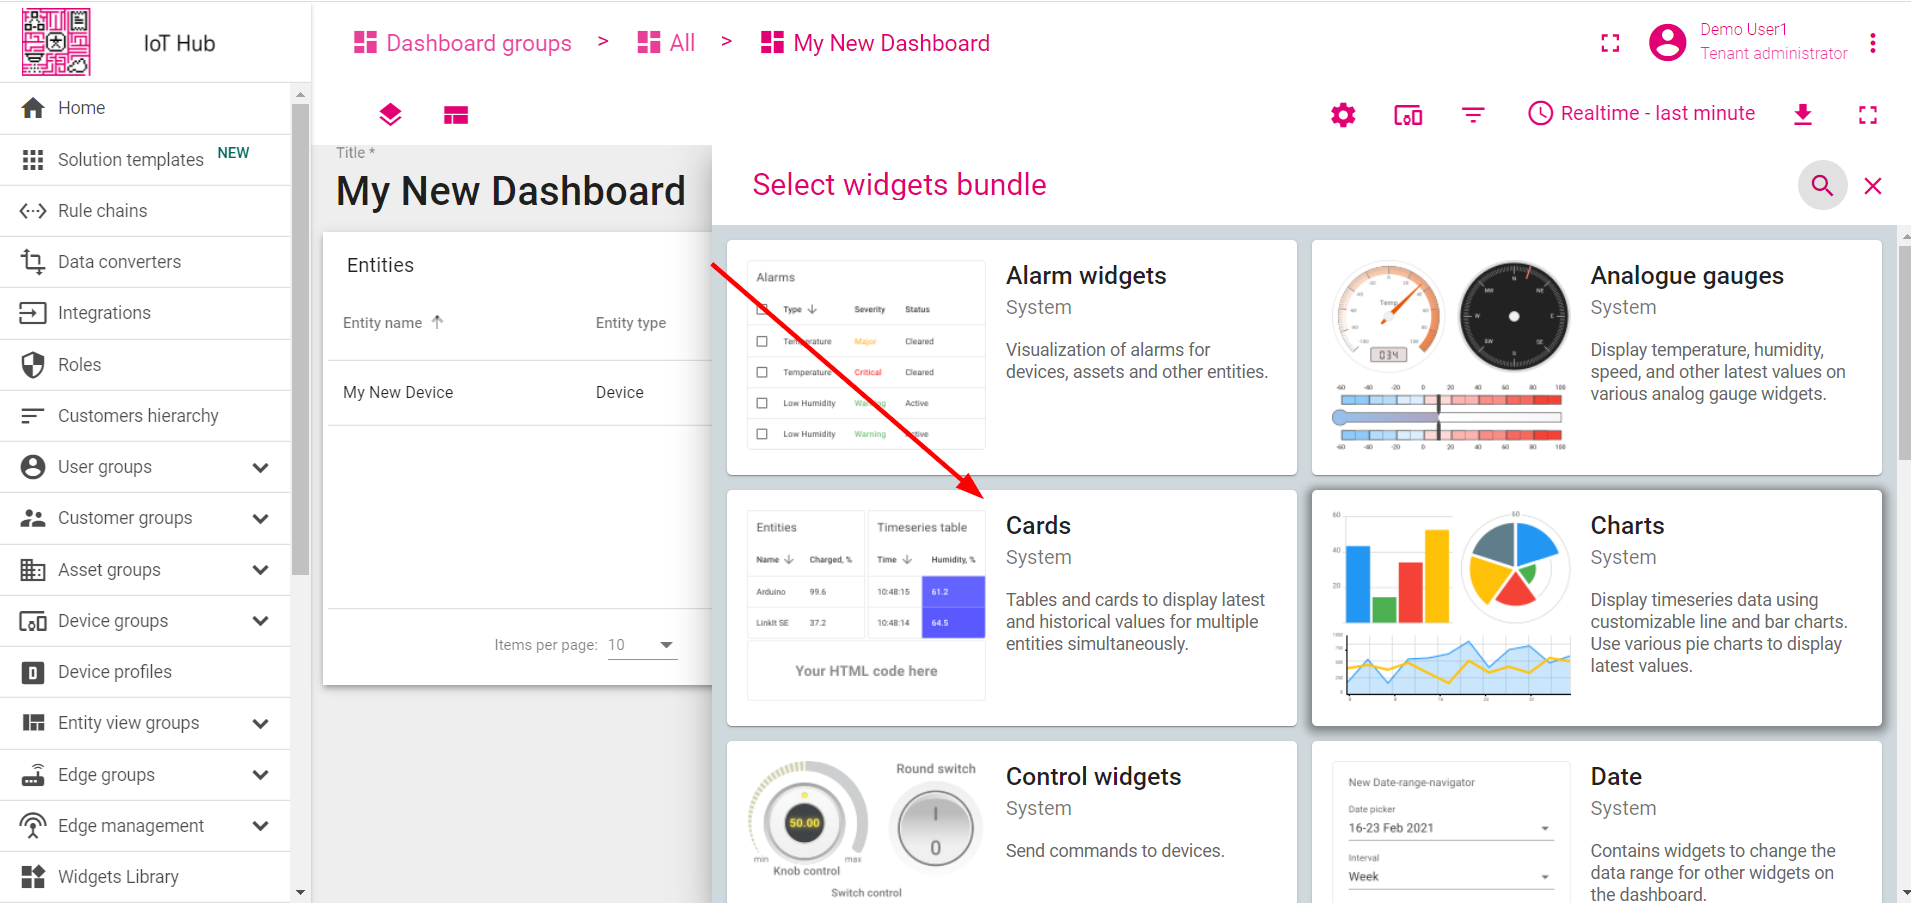
- Select "Charts" bundle.
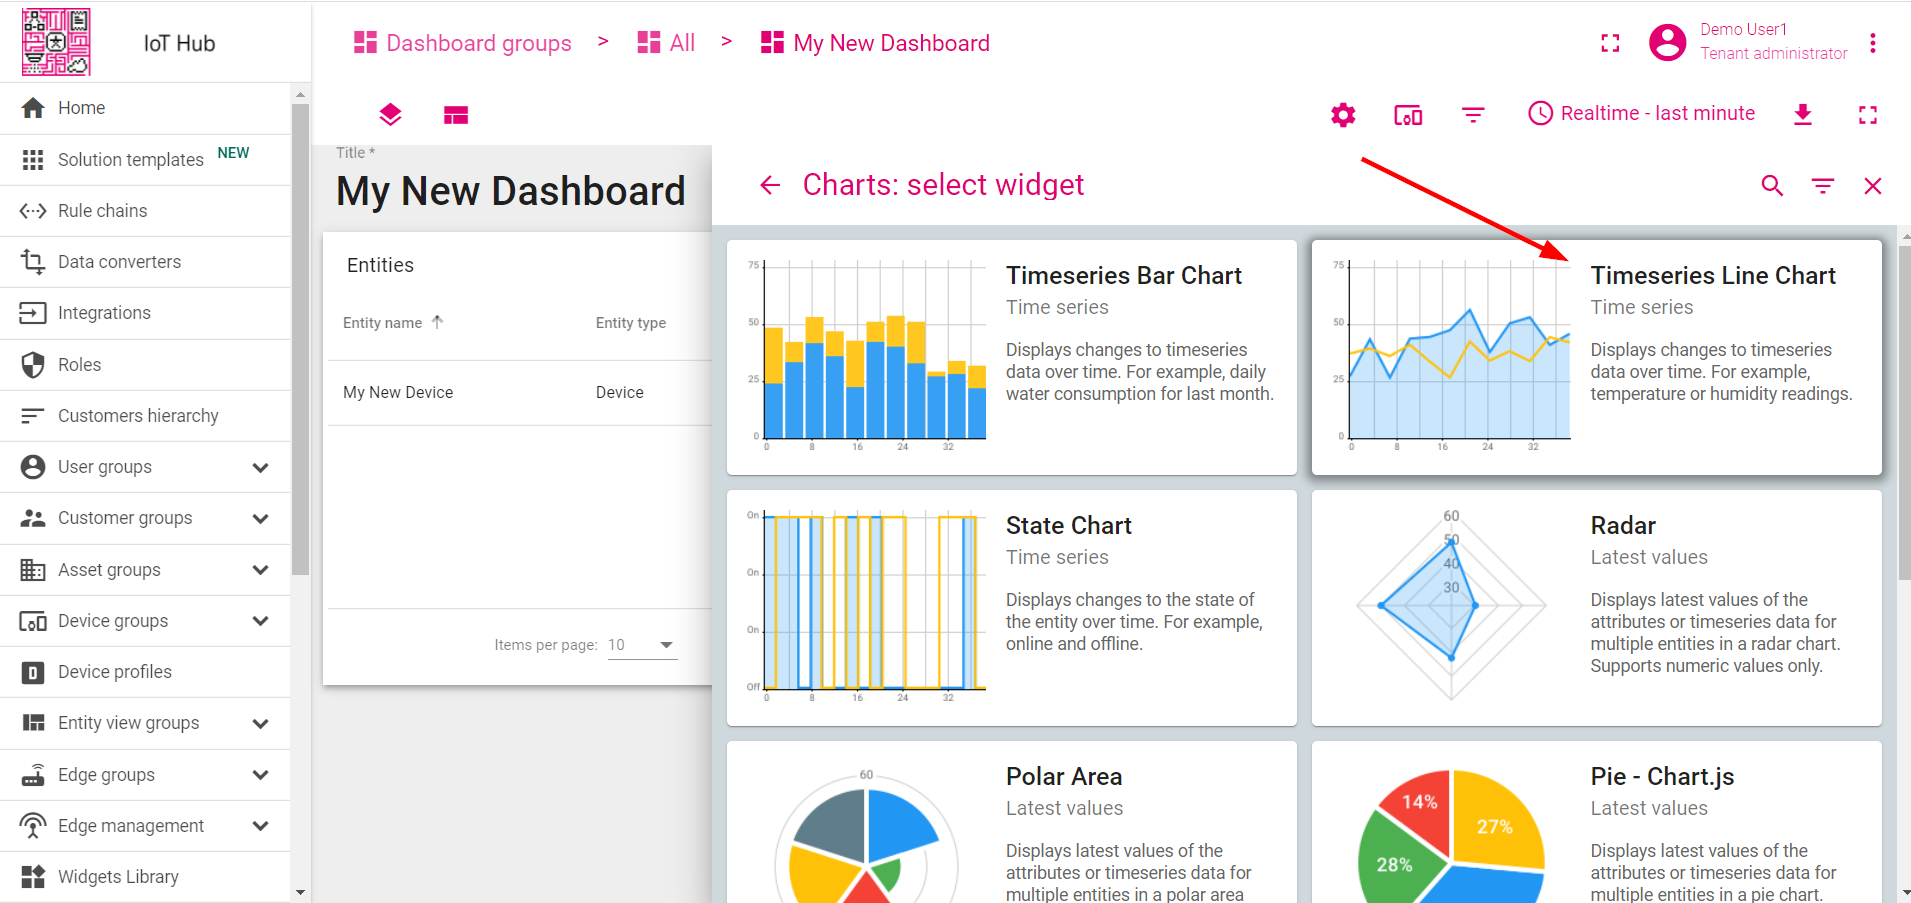
- Select "Timeseries Line Chart" widget.
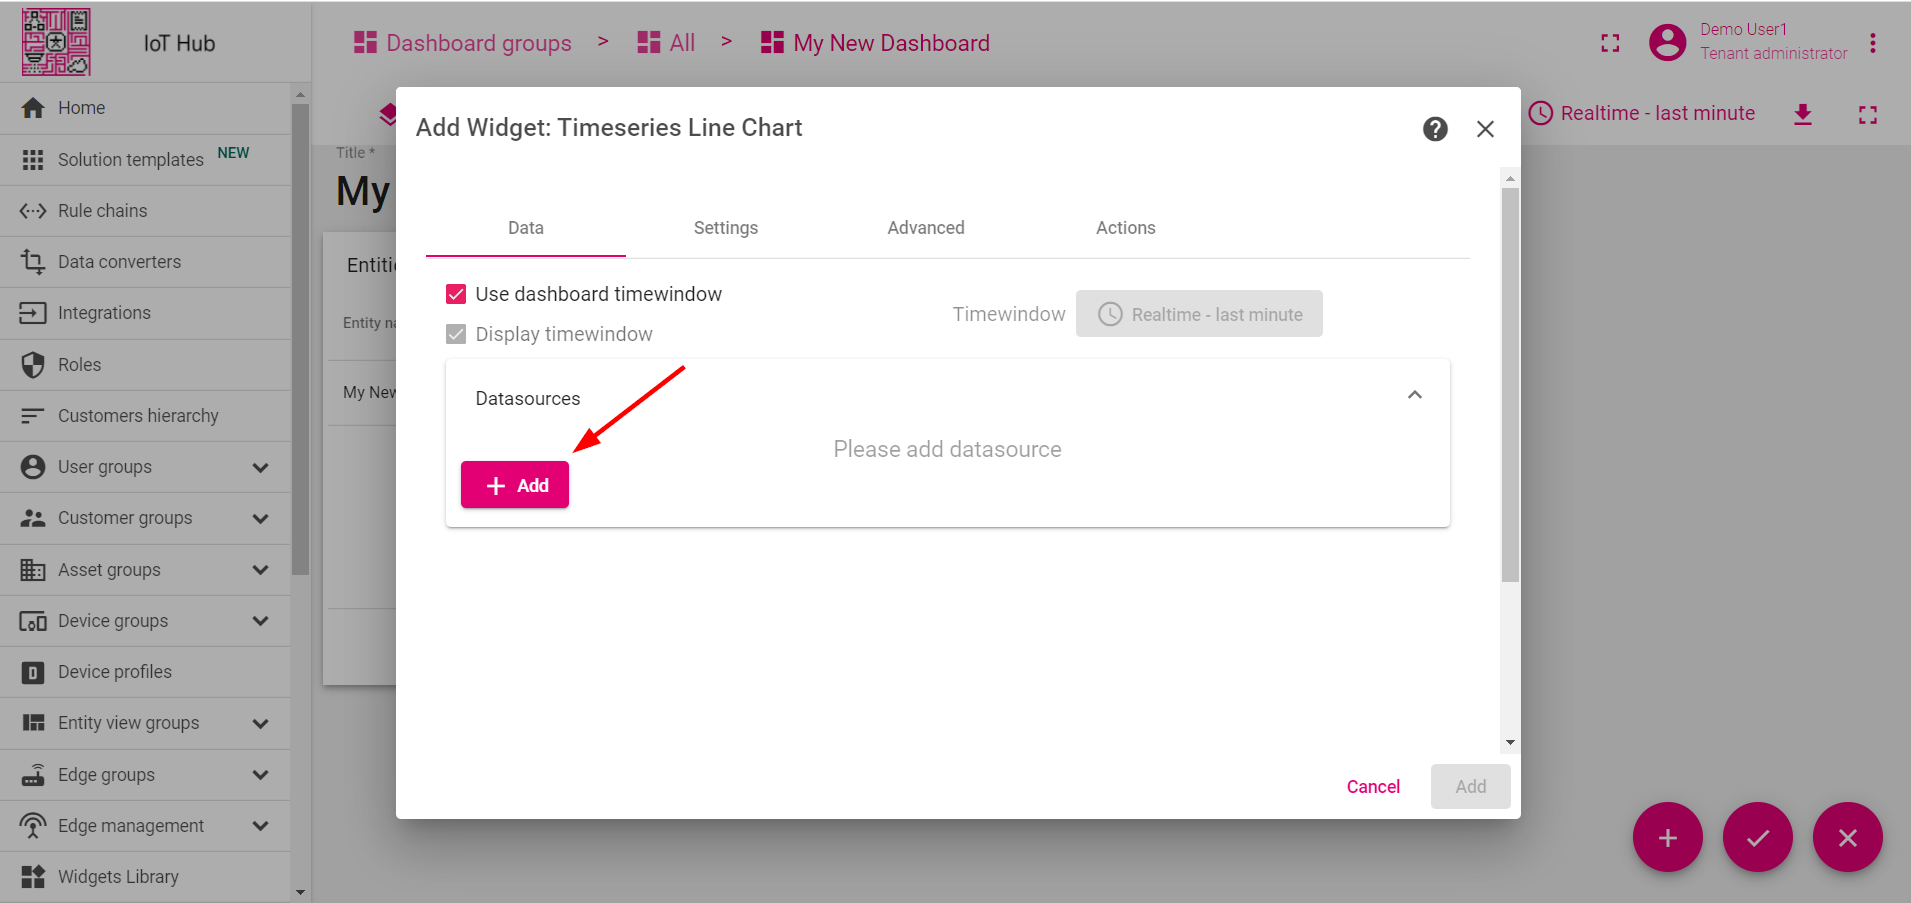
- Click "Add datasource" button.
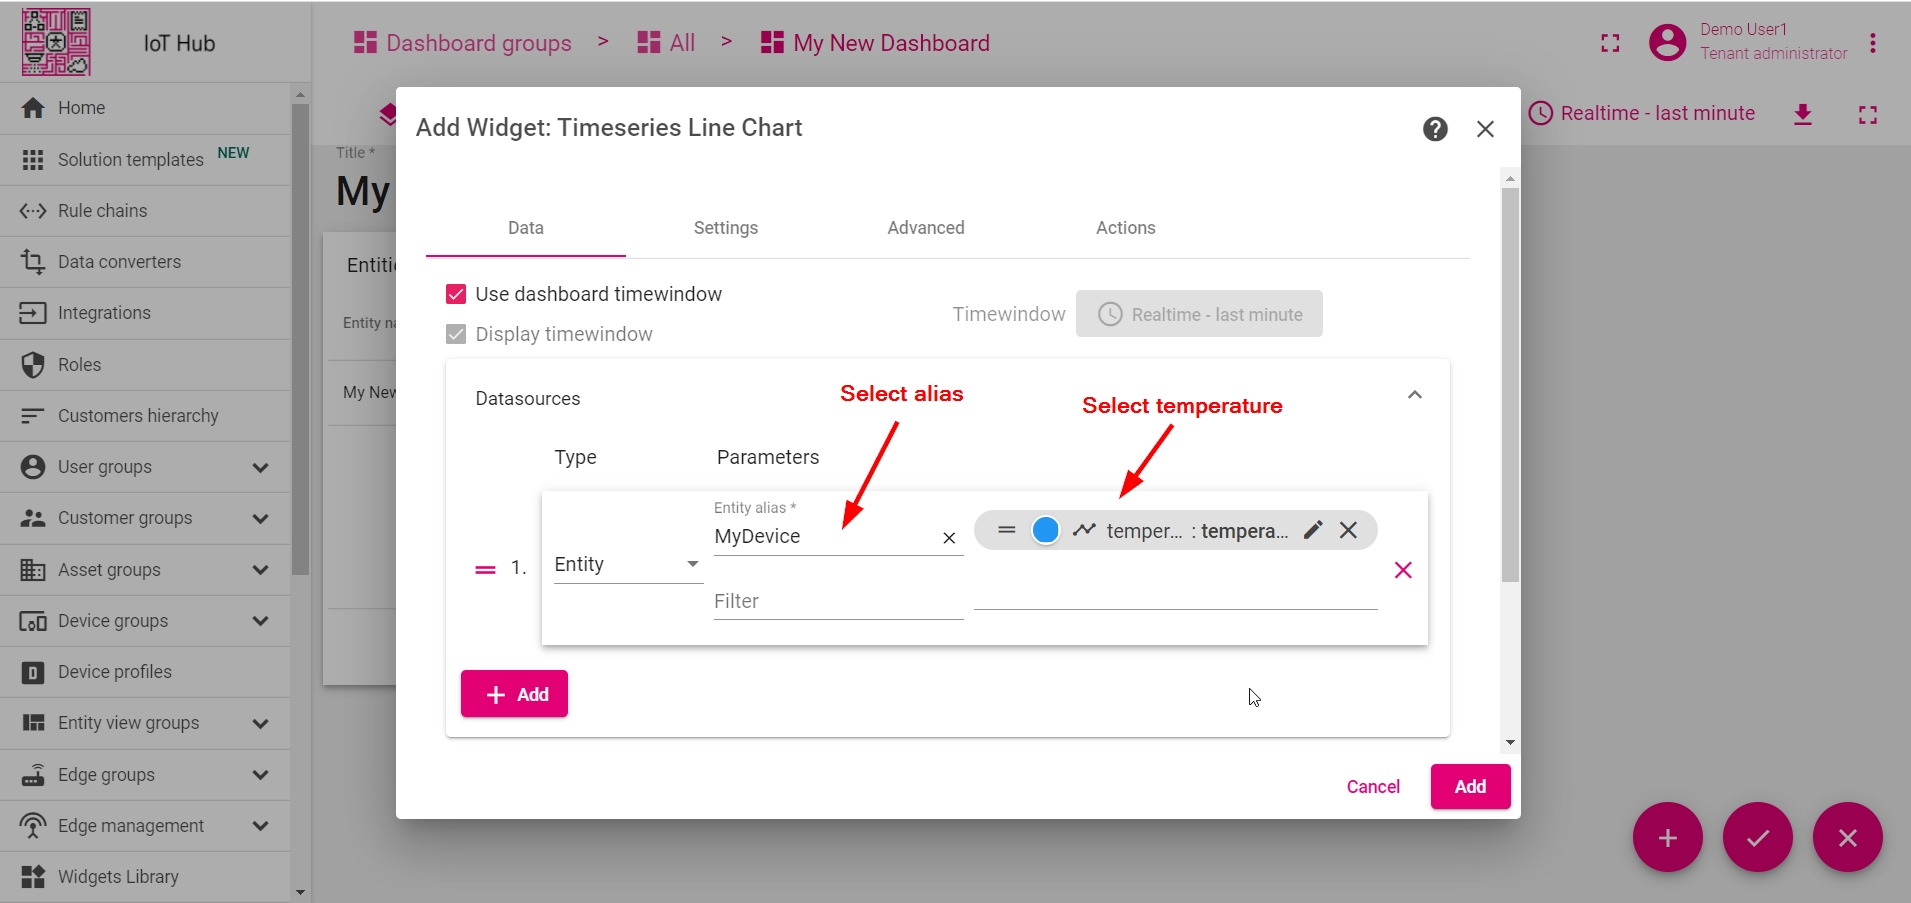
- Select "MyDevice" Alias. Select "temperature" key. Click "Add".
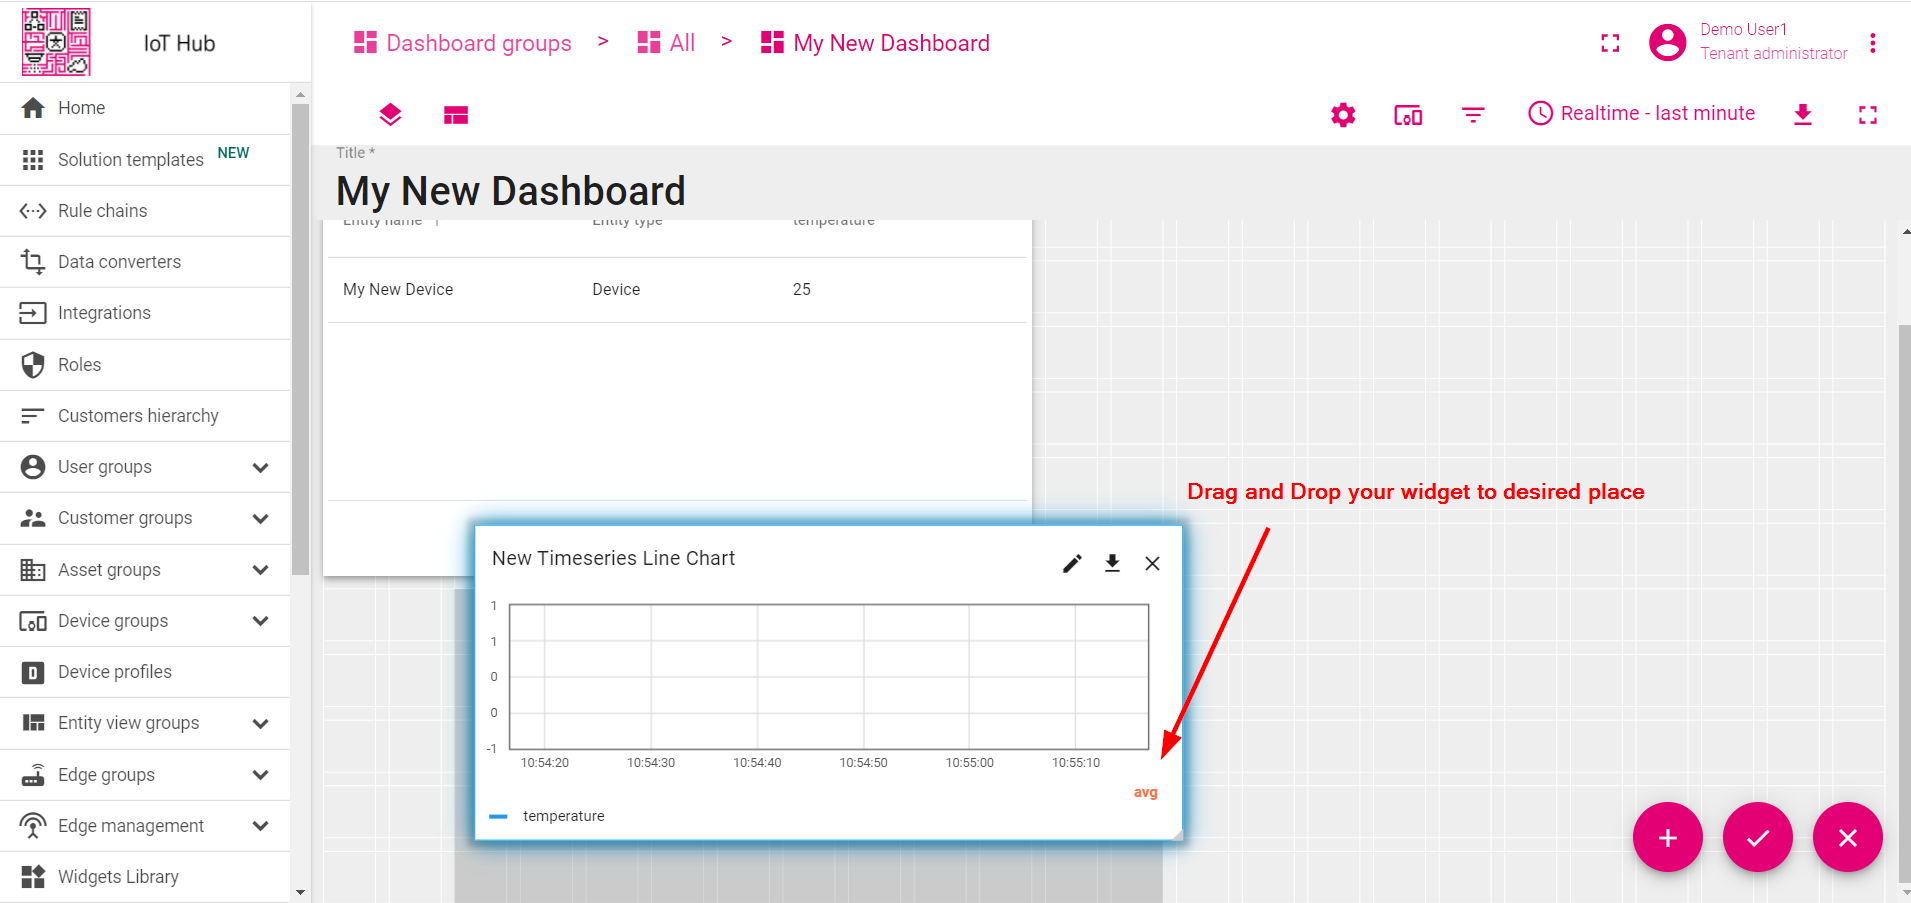
- Drag and Drop you widget to desired space. Resize the widget. Apply changes.
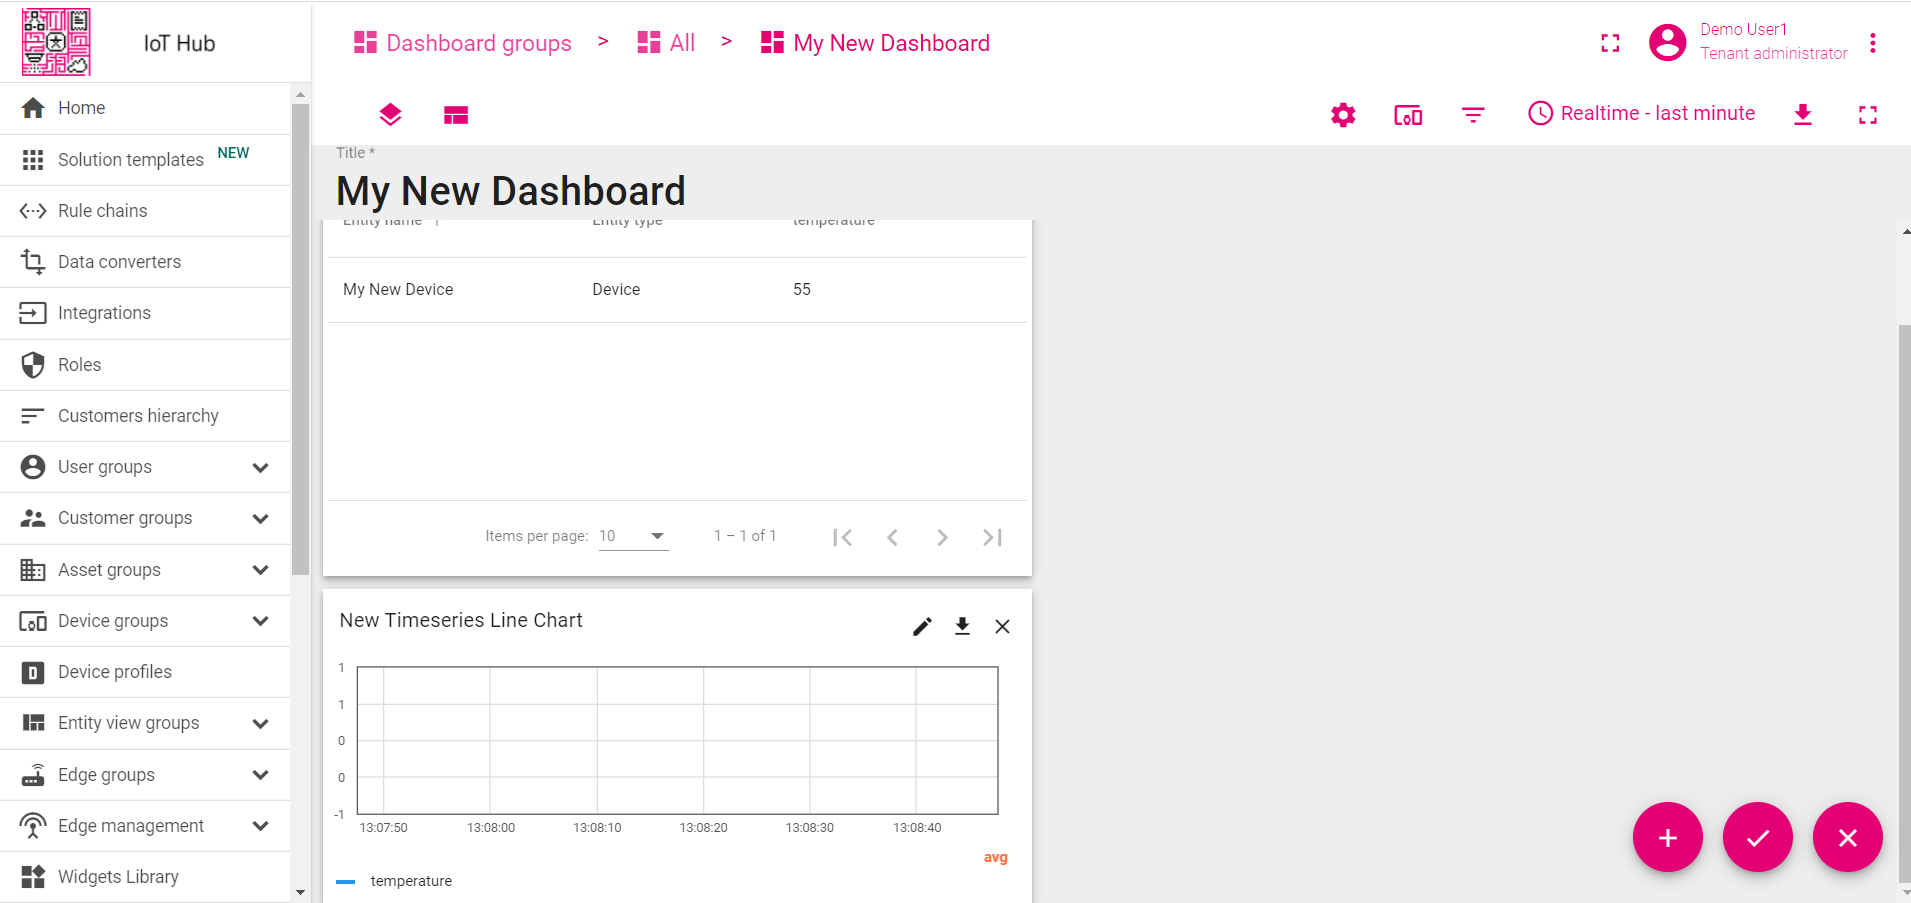
- Publish different telemetry values multiple times Step 2. Note that the widget displays only one minute of data by default.
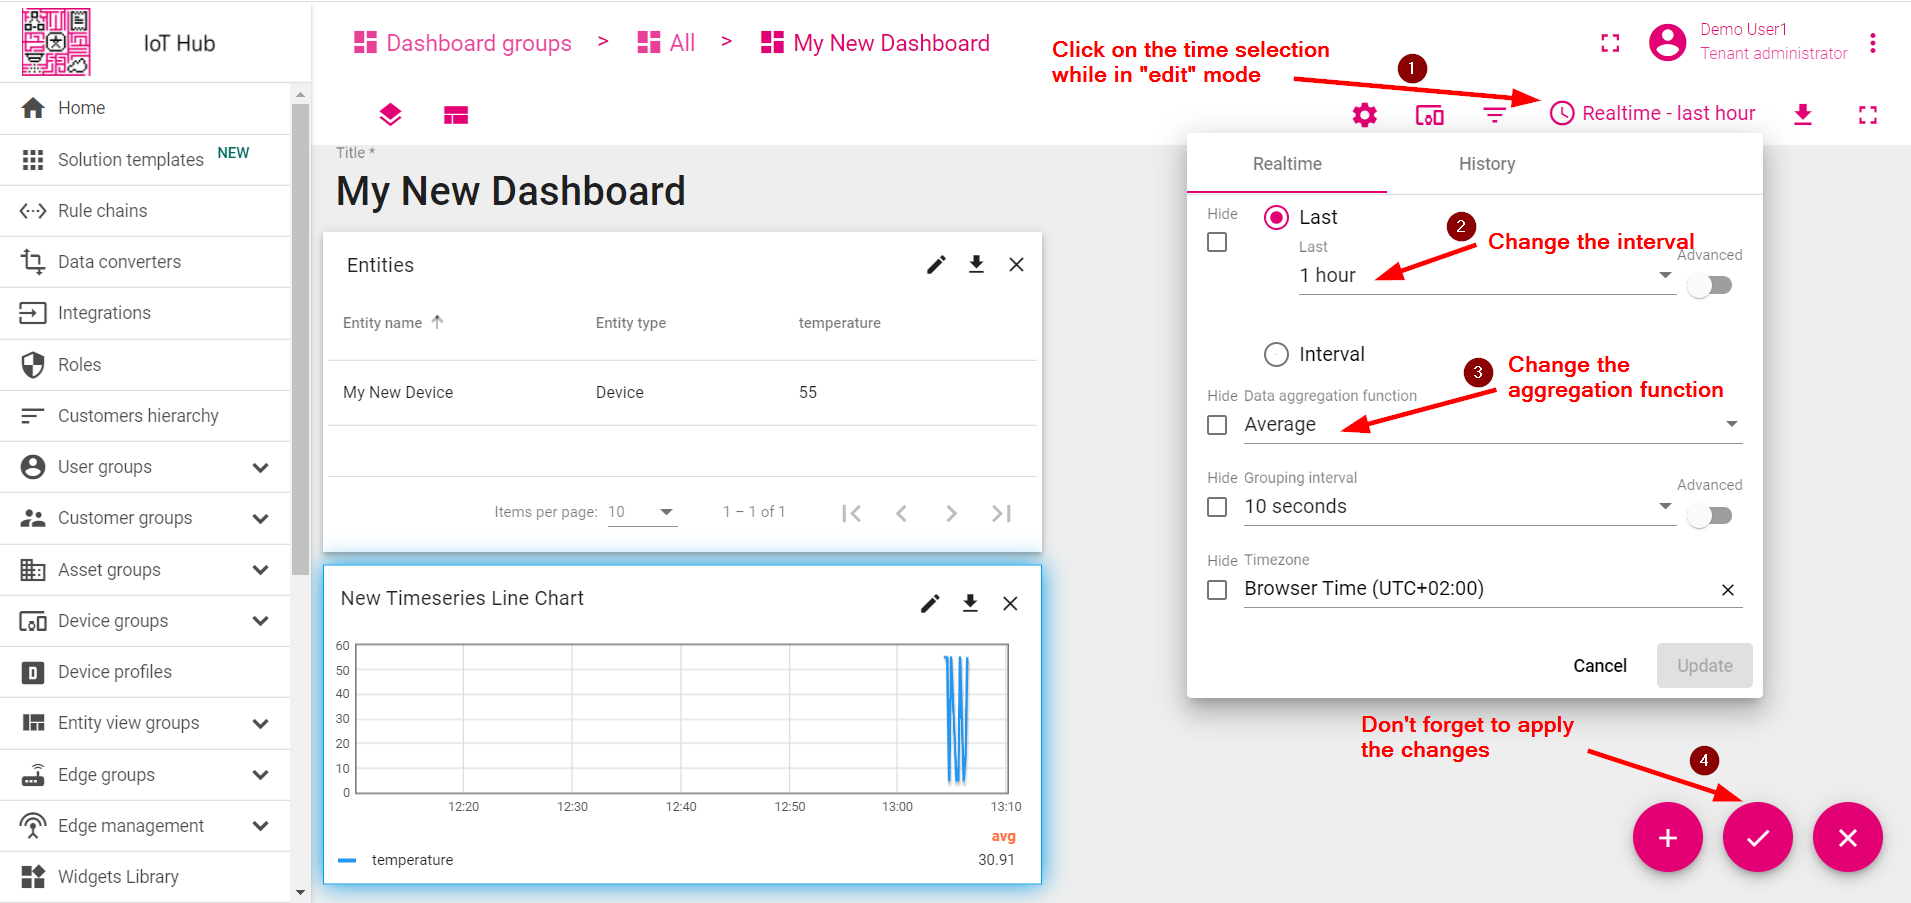
- Enter Edit mode. Open time selection window. Change the interval and aggregation function. Update the time window and apply changes.
Congratulations! You have added chart widget. Now you are able to send new telemetry reading and it will immediately appear in the chart.
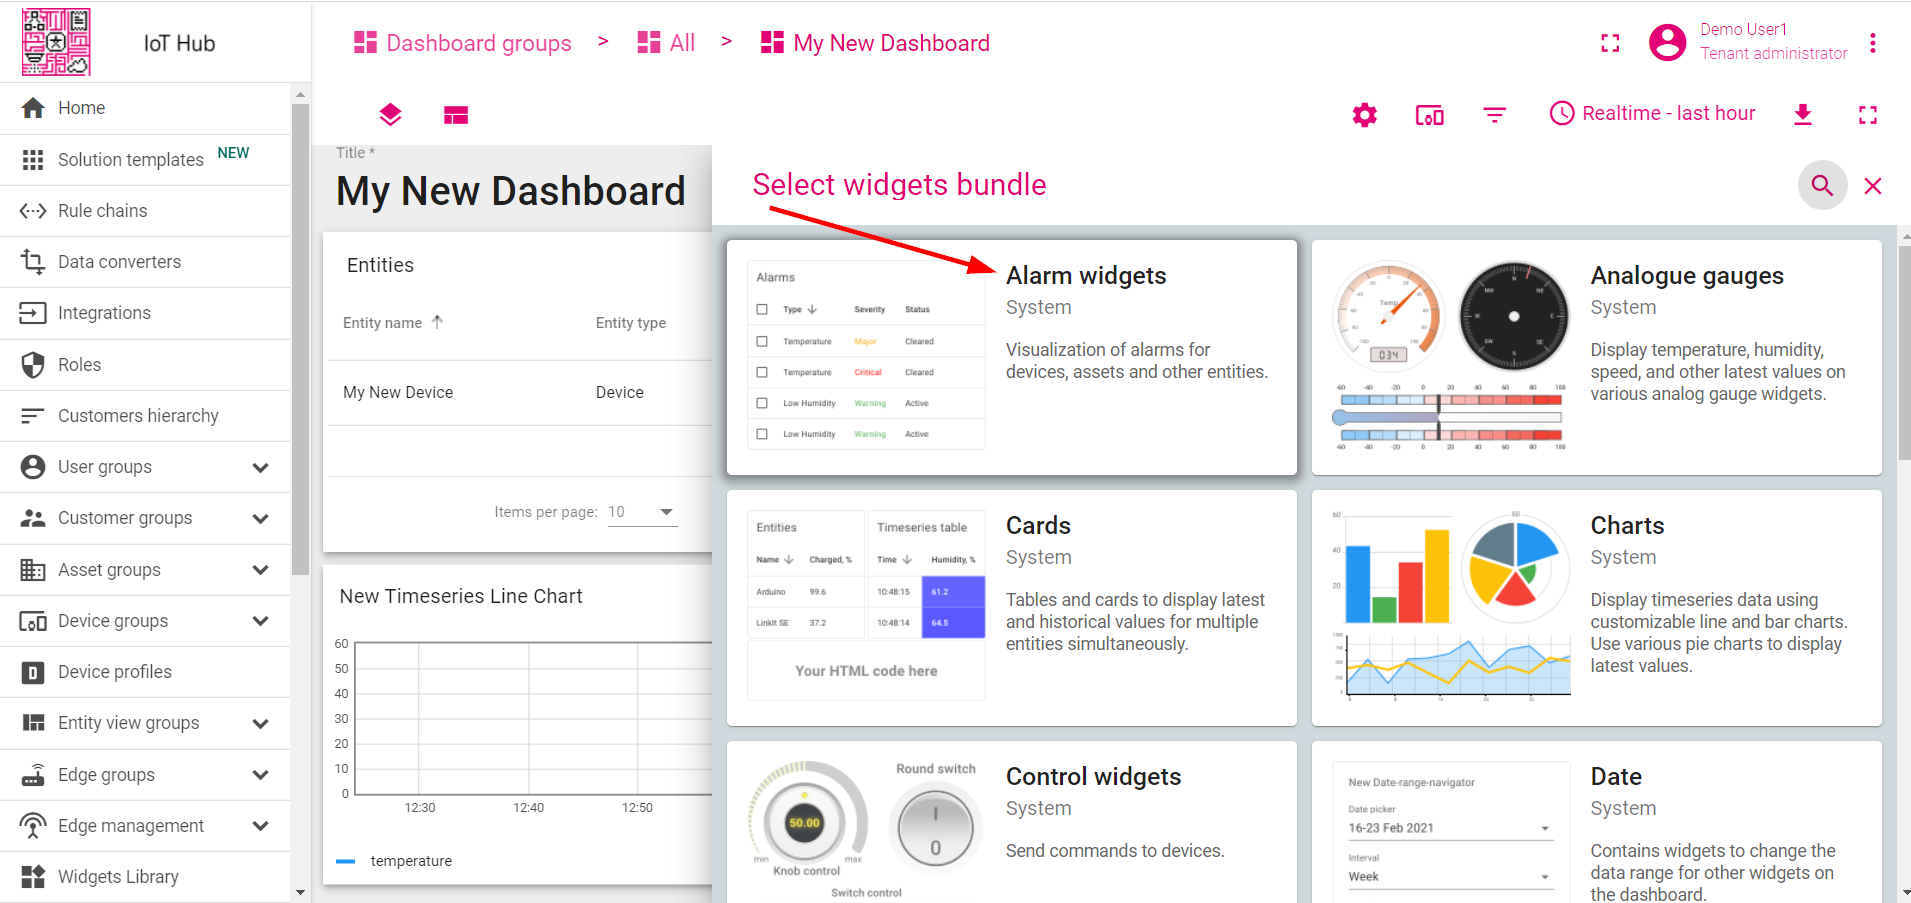
Step 3.5 Add alarm widget
- Enter Edit mode.
- Click "Add new widget" icon in the bottom right corner of the screen.
- Click "Create new widget" icon.
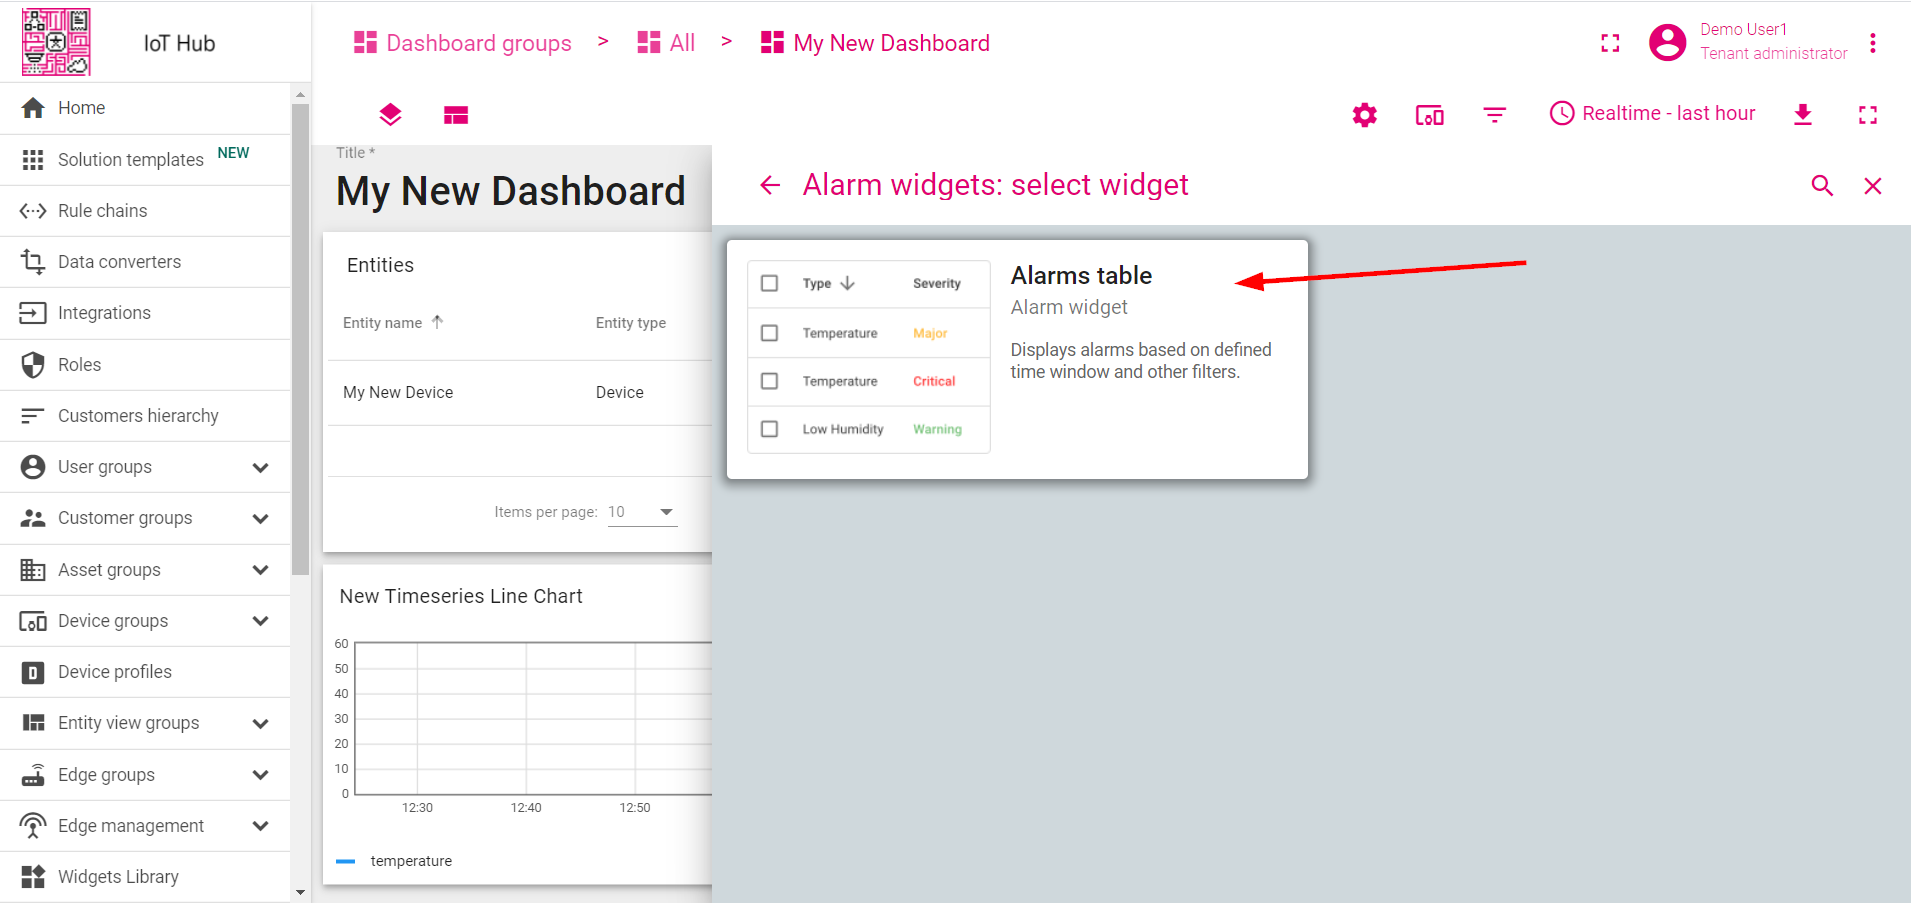
- Select "Alarm widgets" bundle.
- Select "Alarm table" widget.
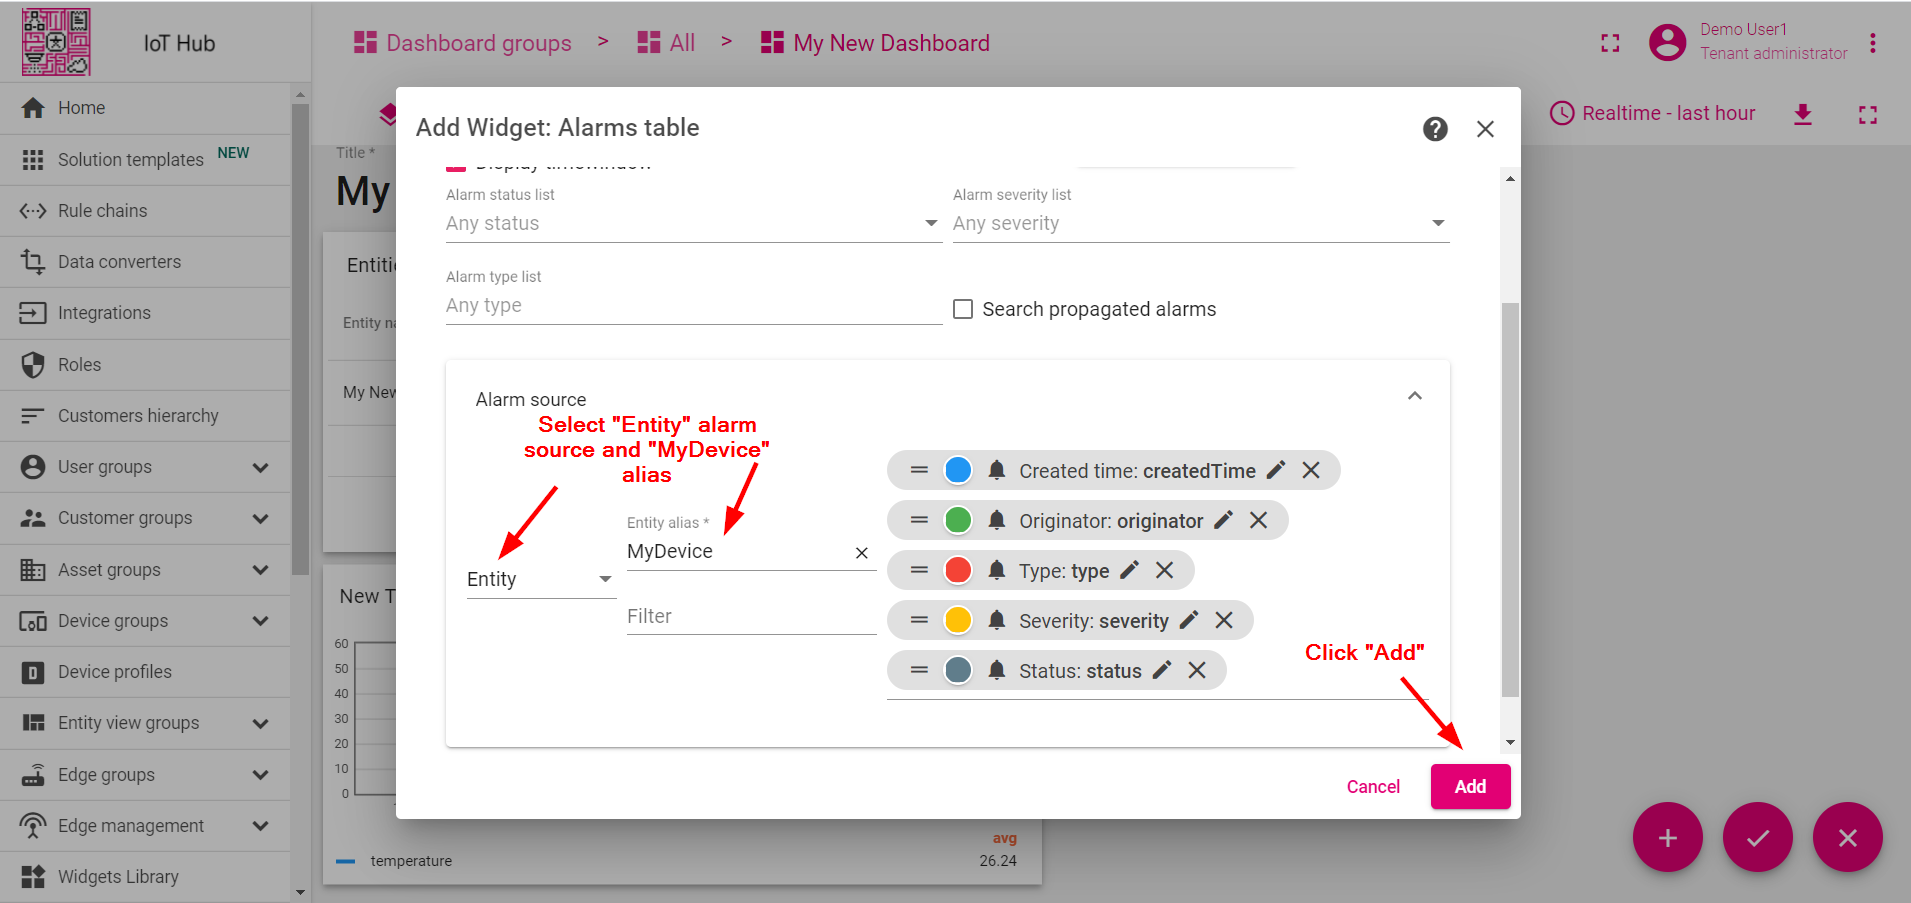
- Select "Entity" alarm source and "MyDevice" alias. Click "Add"
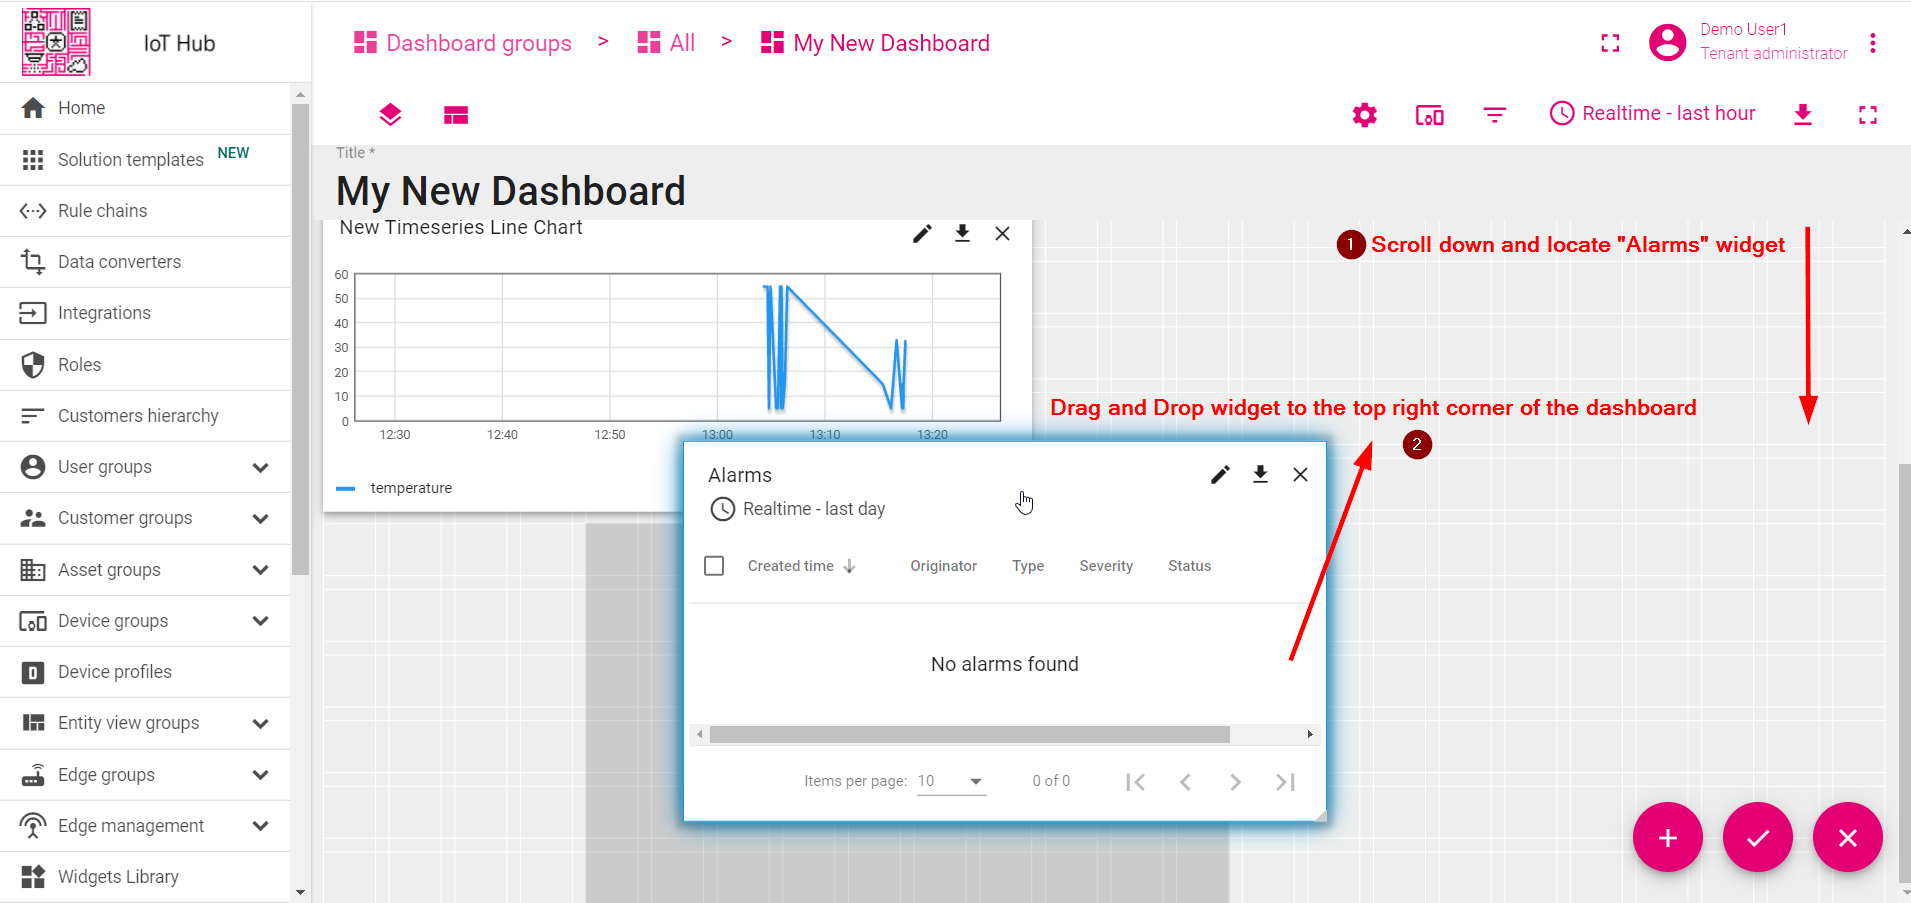
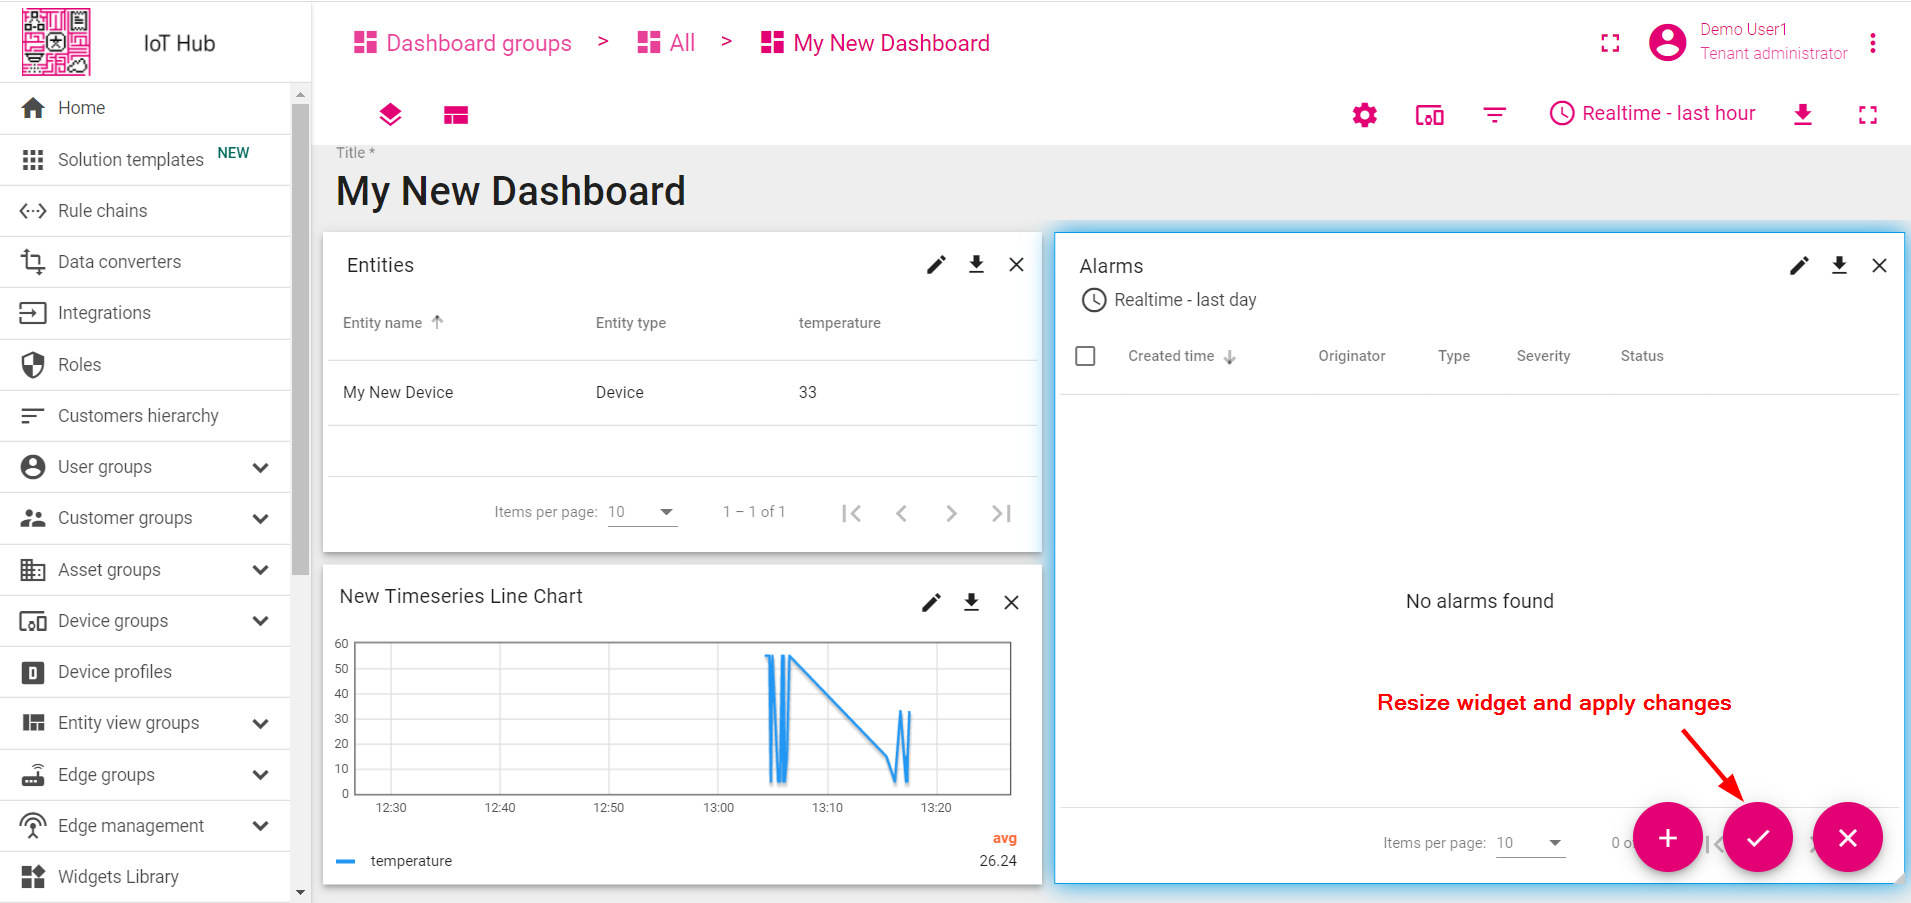
- Scroll down and locate new "Alarms" widget. Drag and Drop widget to the top right corner of the dashboard.
- Resize the widget and apply changes.
Congratulations! You have added alarm widget. Now it’s time to configure alarm rules and raise some alarms.
Step 4. Configure alarm rules
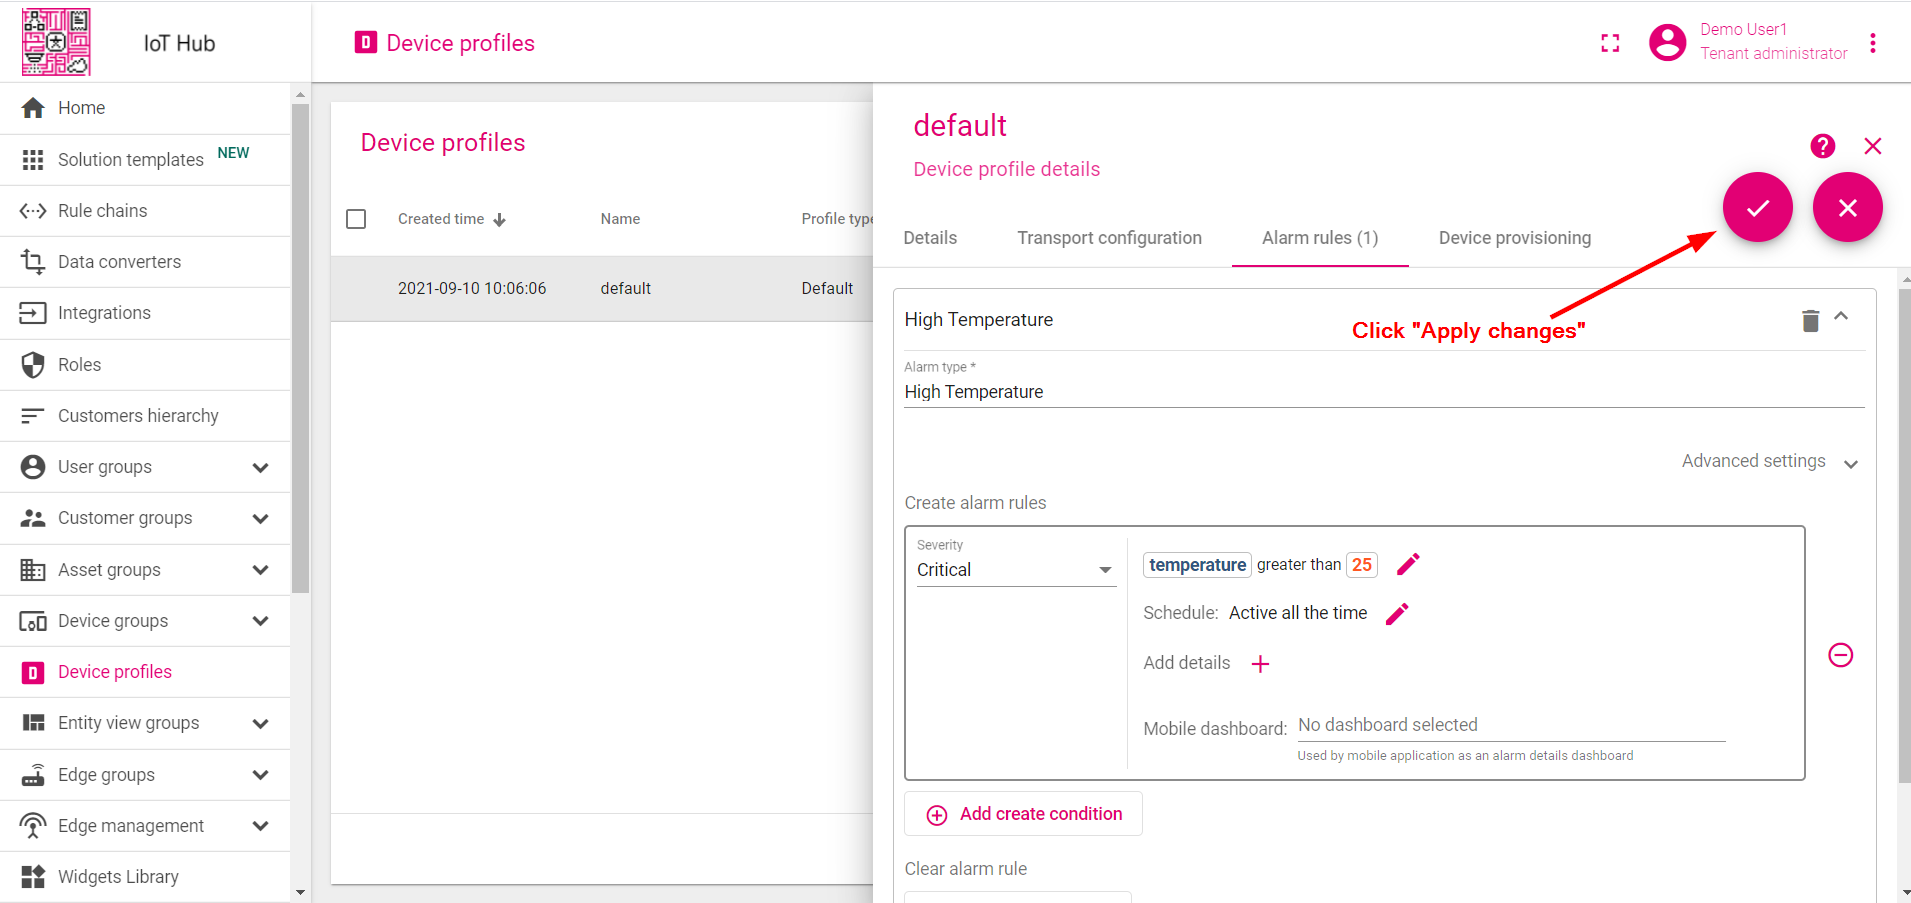
We will use the alarm rules feature to raise alarm when the temperature reading is greater than 25 degrees. For this purpose, we should edit the device profile and add a new alarm rule. The “My New Device” is using the “Default” device profile. We recommend creating dedicated device profiles for each corresponding device type but will skip this step for simplicity.
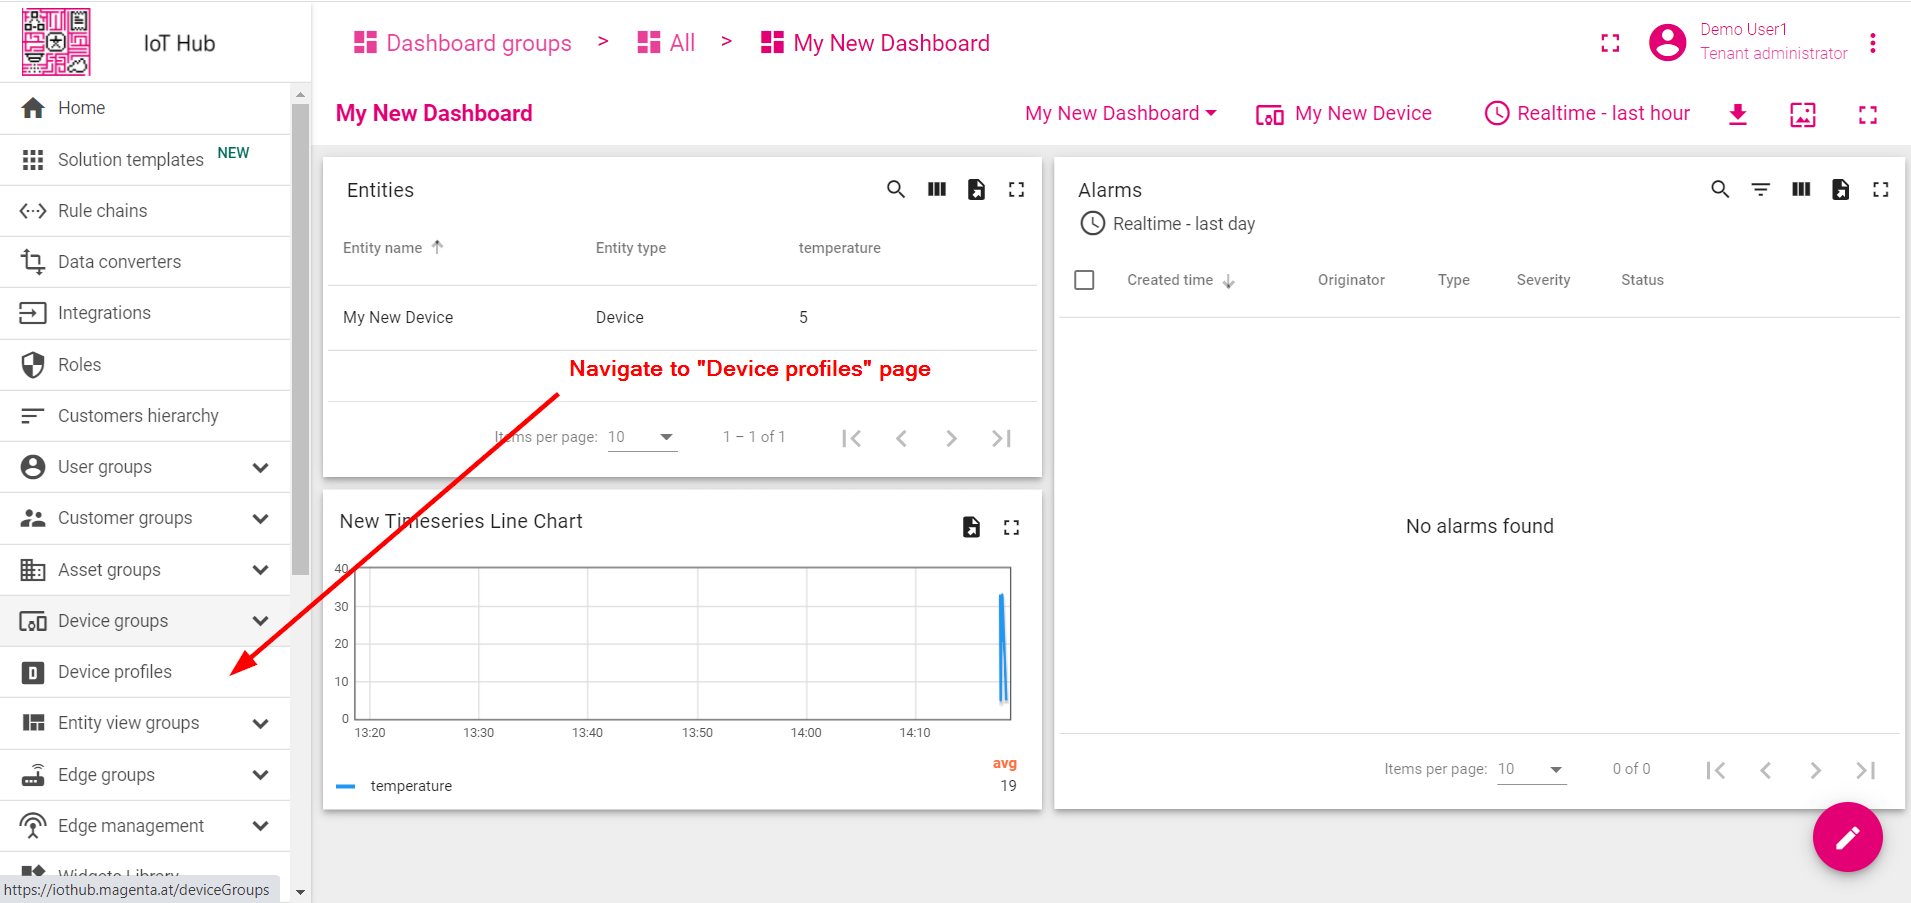
- Navigate to the device profiles page.
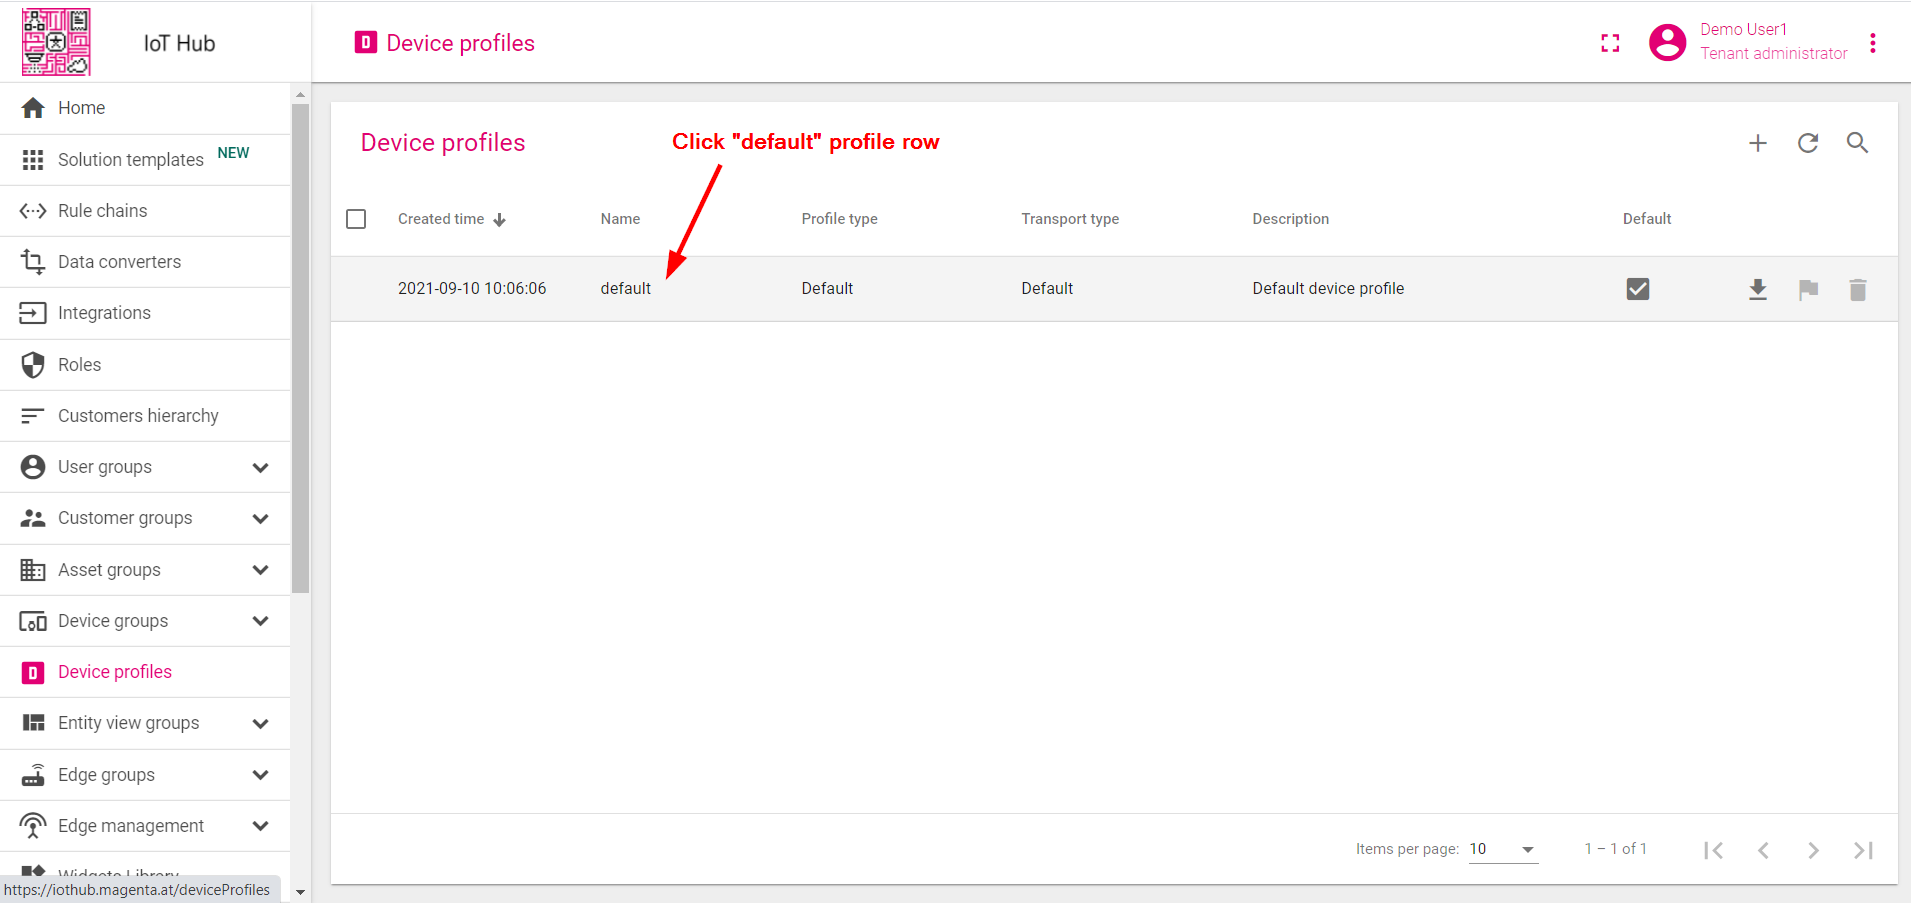
- Click the default profile row. This will open device profile details.
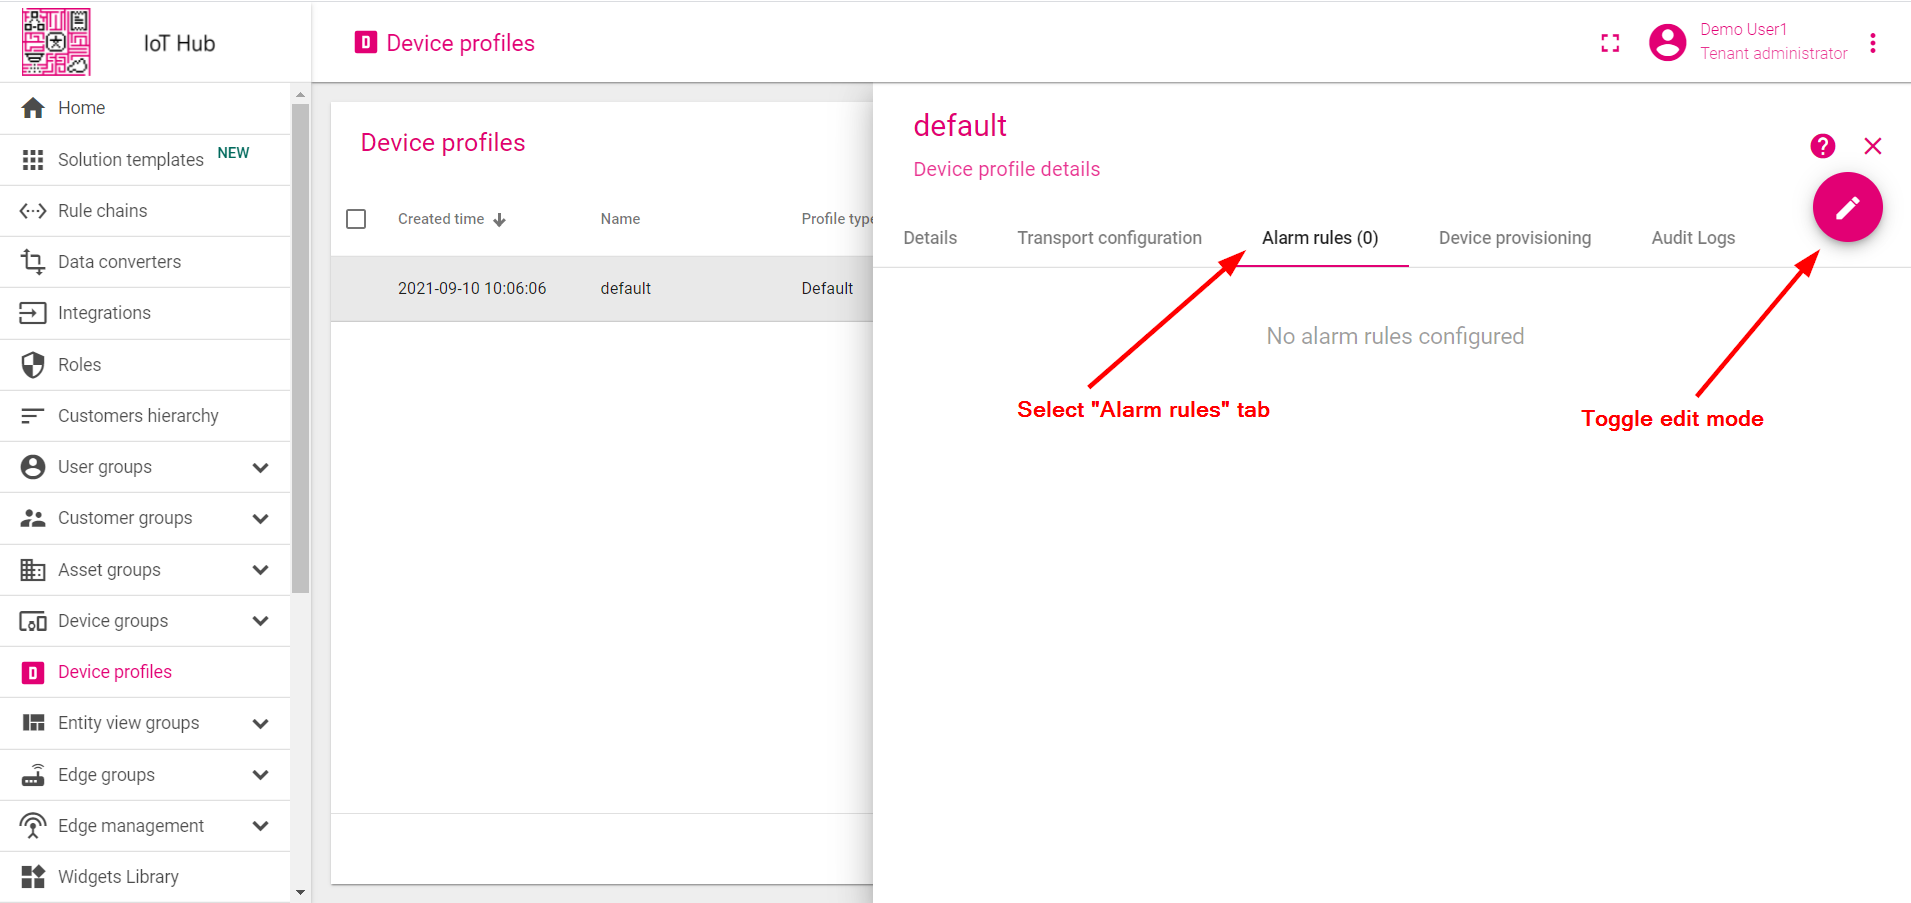
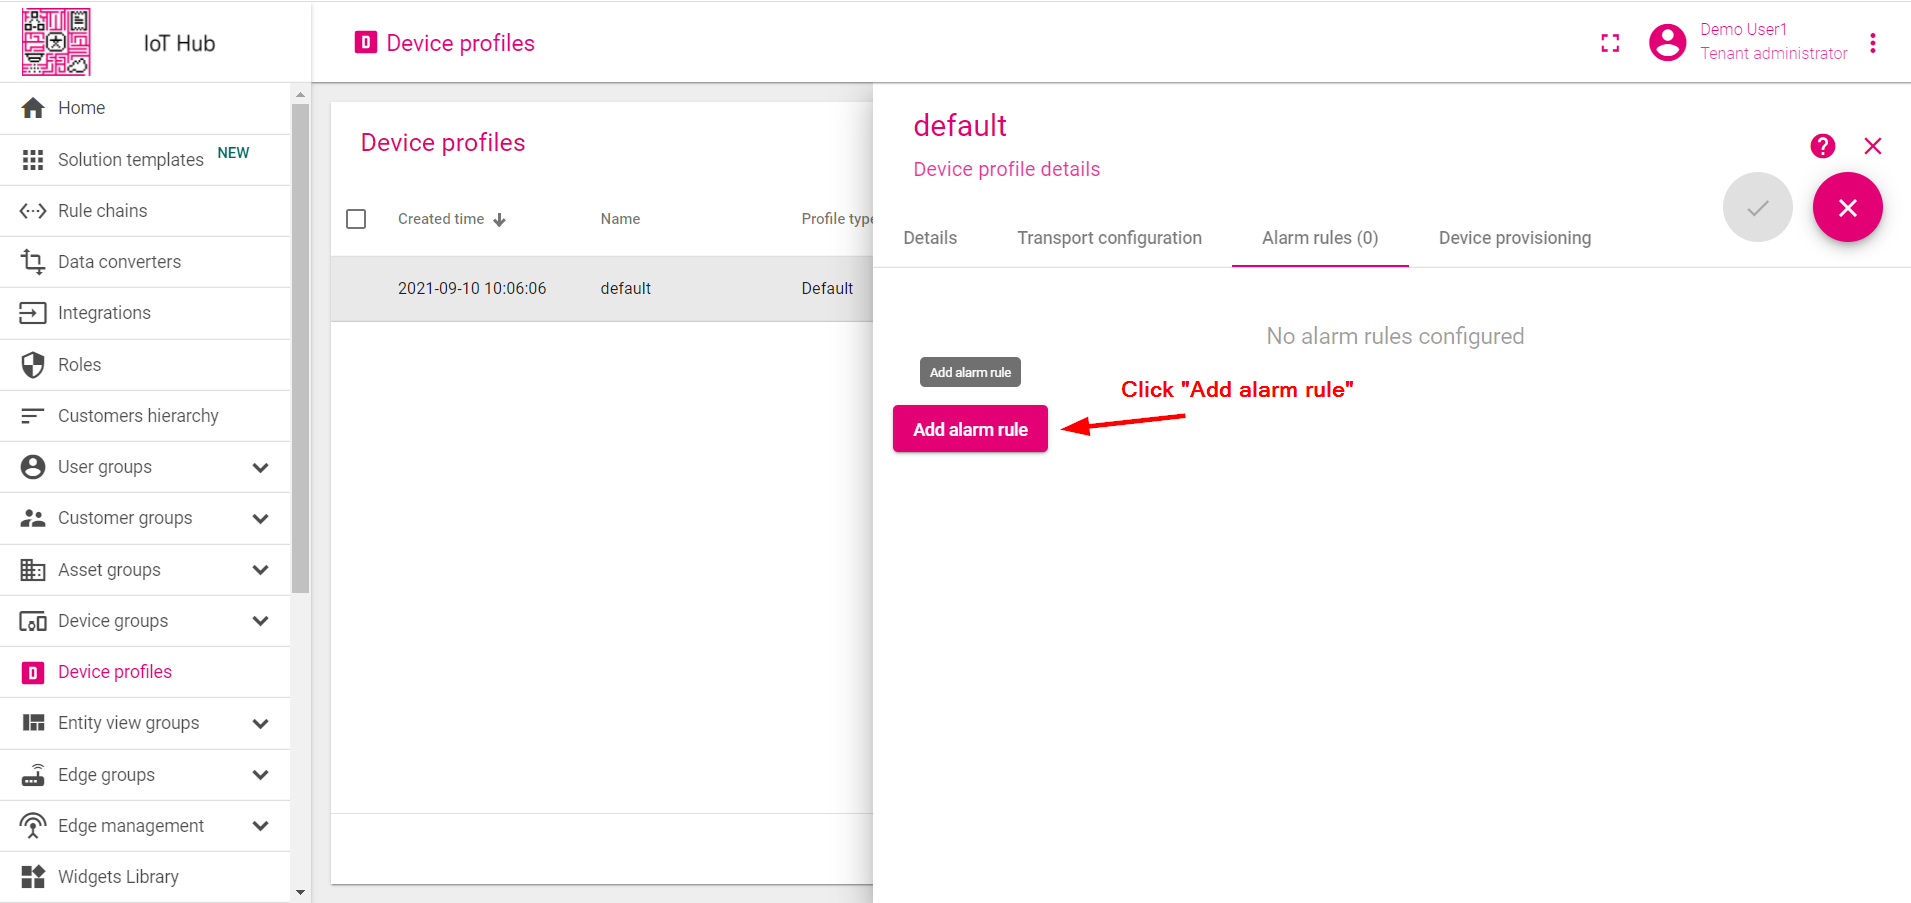
- Select the "Alarm Rules" tab and toggle edit mode.
- Click "Add alarm rule".
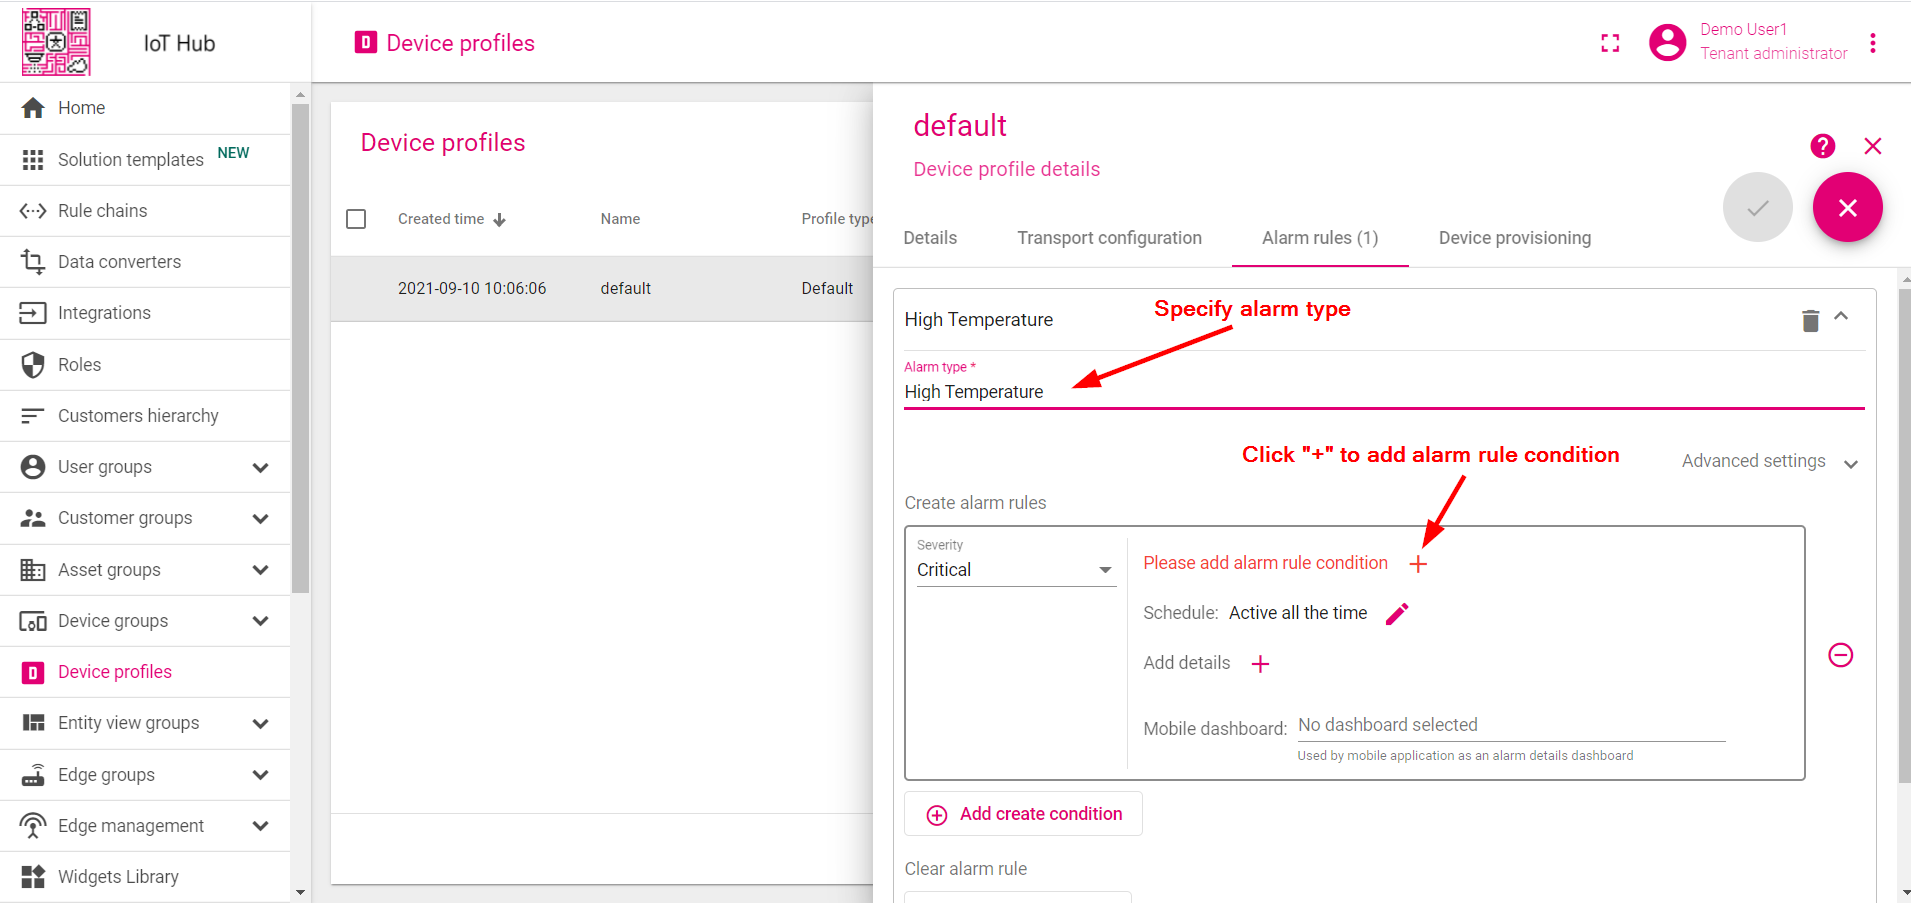
- Specify alarm type and click the "+" icon to add alarm rule condition.
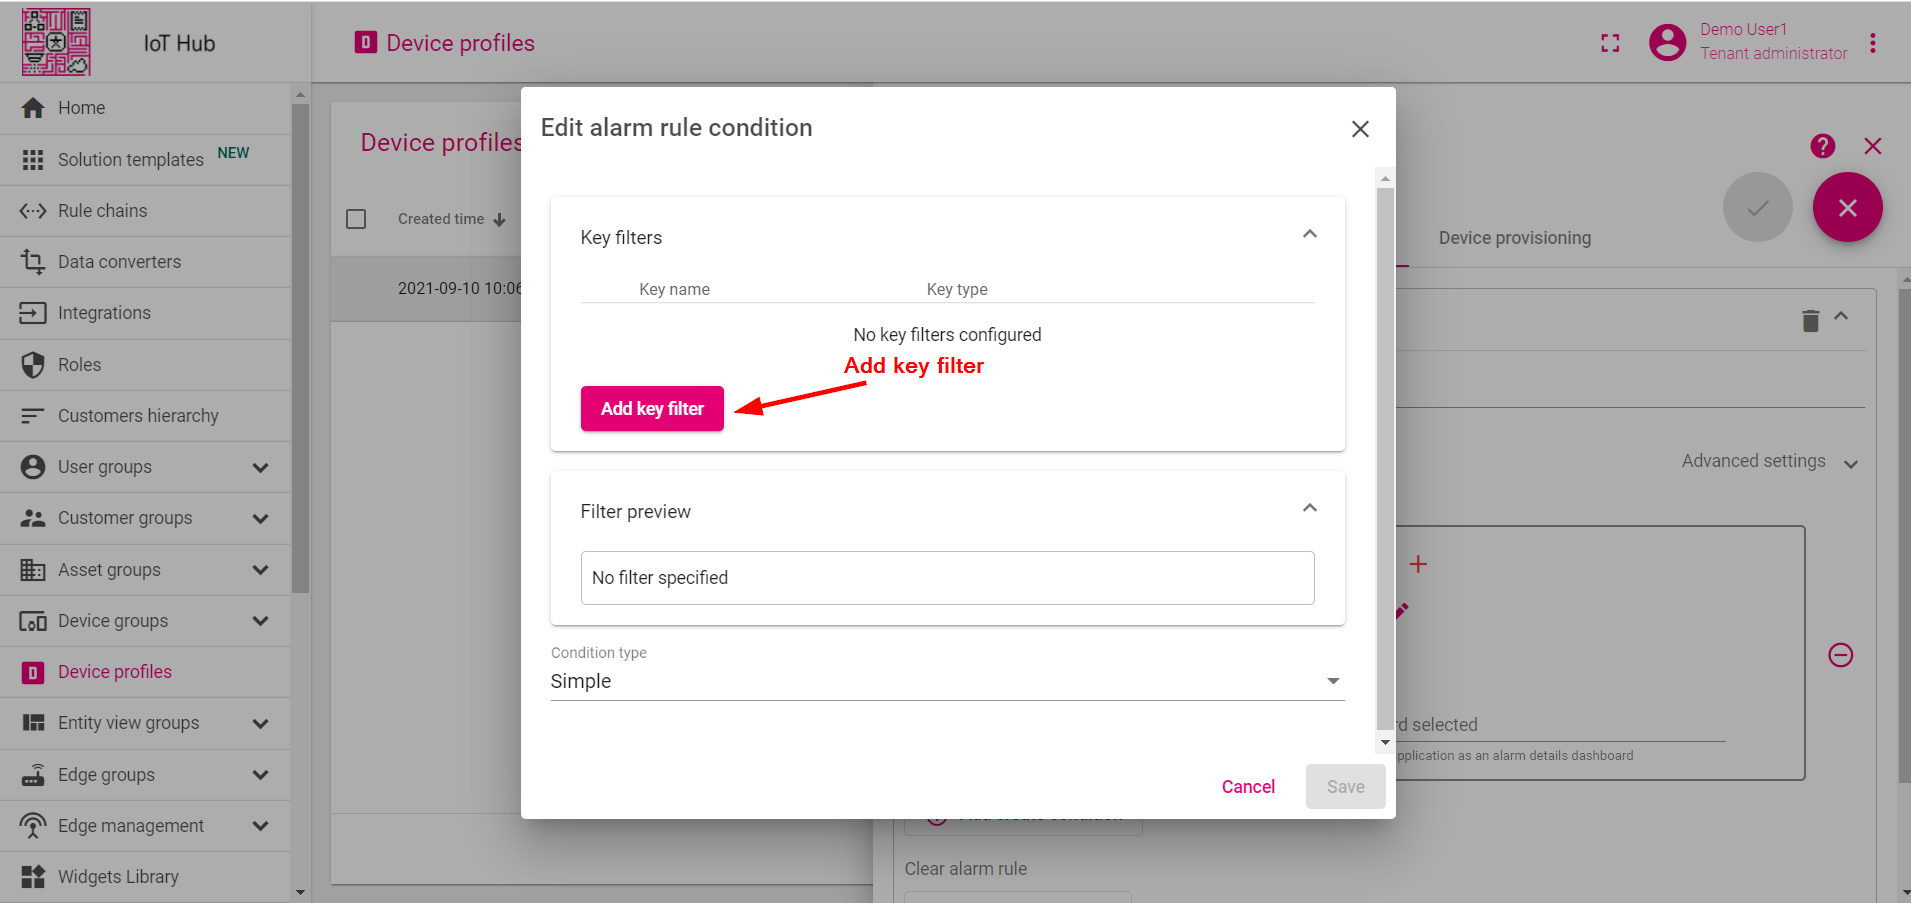
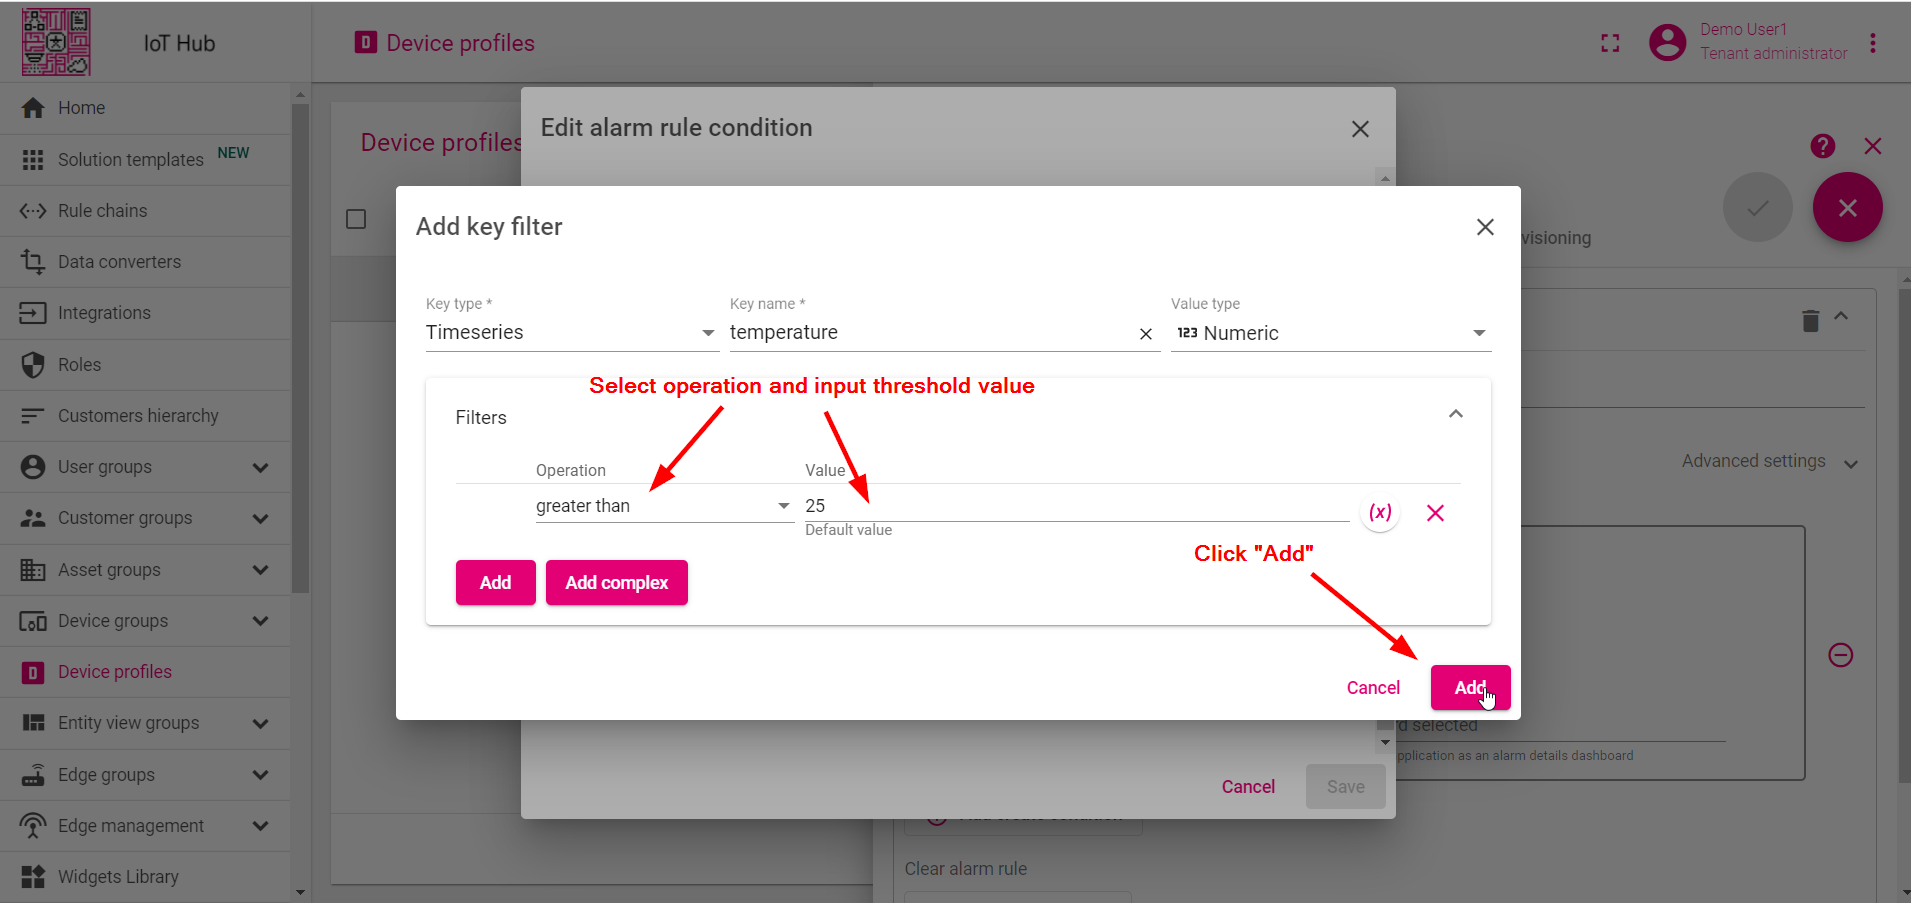
- Click the "Add key filter" button to specify a condition.
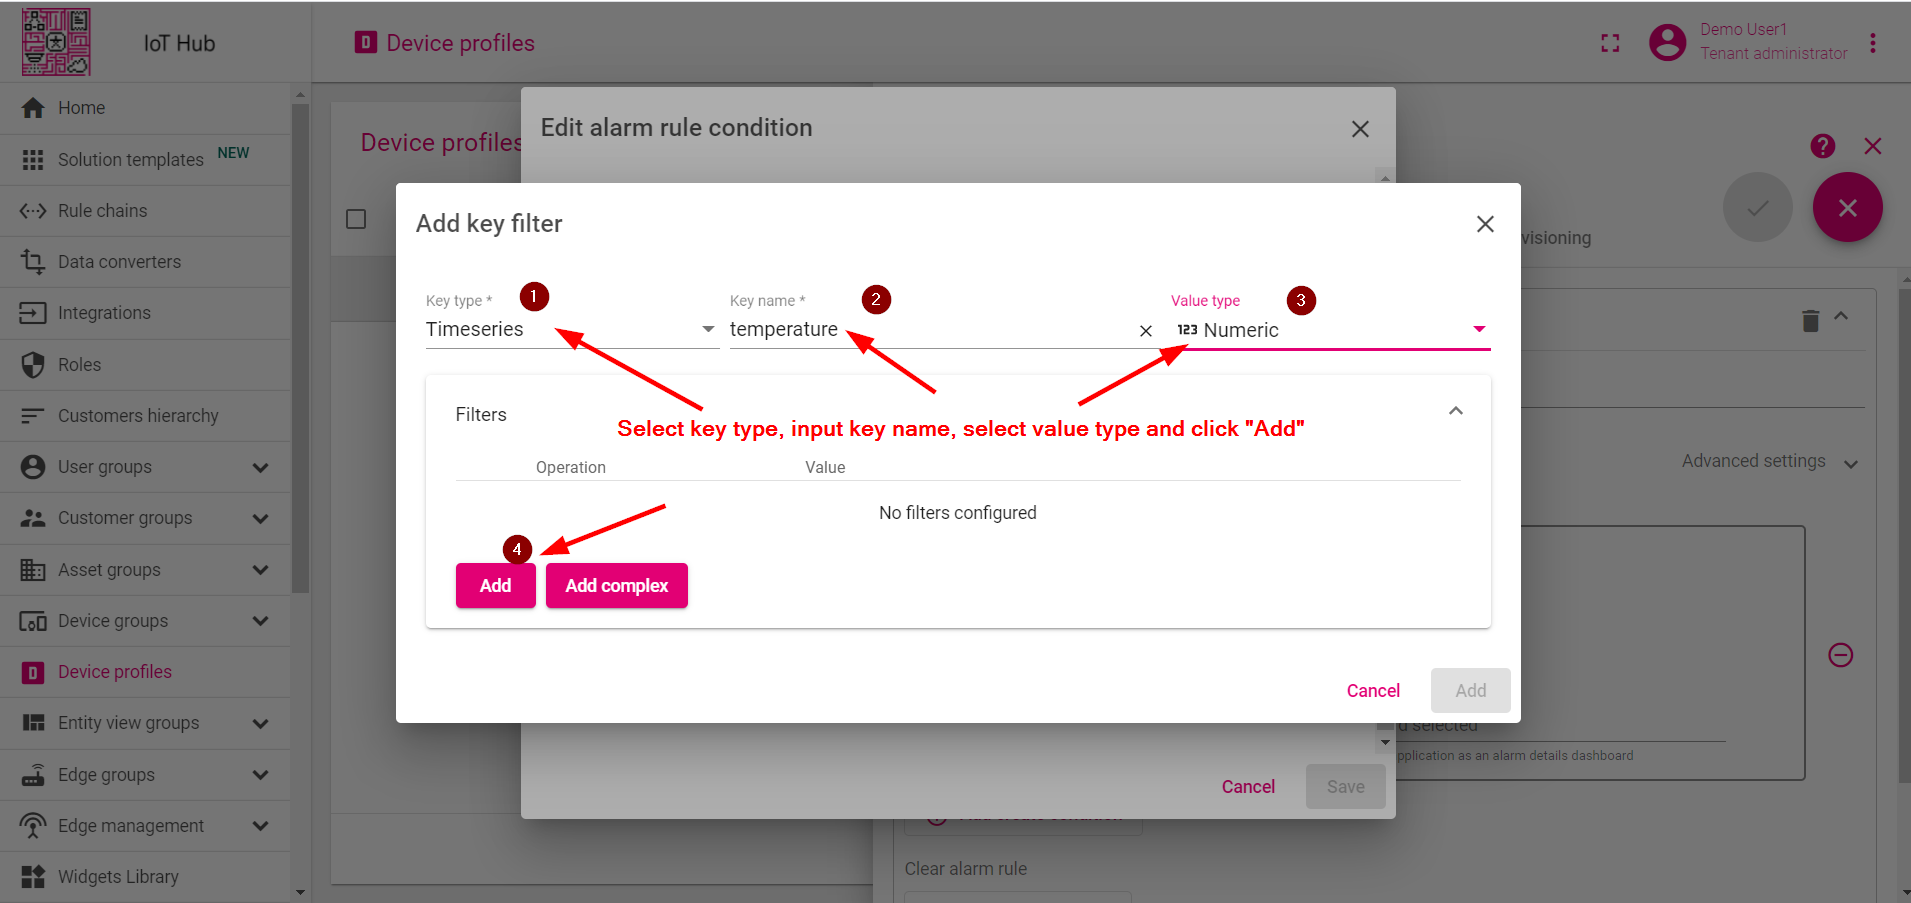
- Select key type, input key name, select value type, and click "Add".
- Select operation and input threshold value. Click "Add".
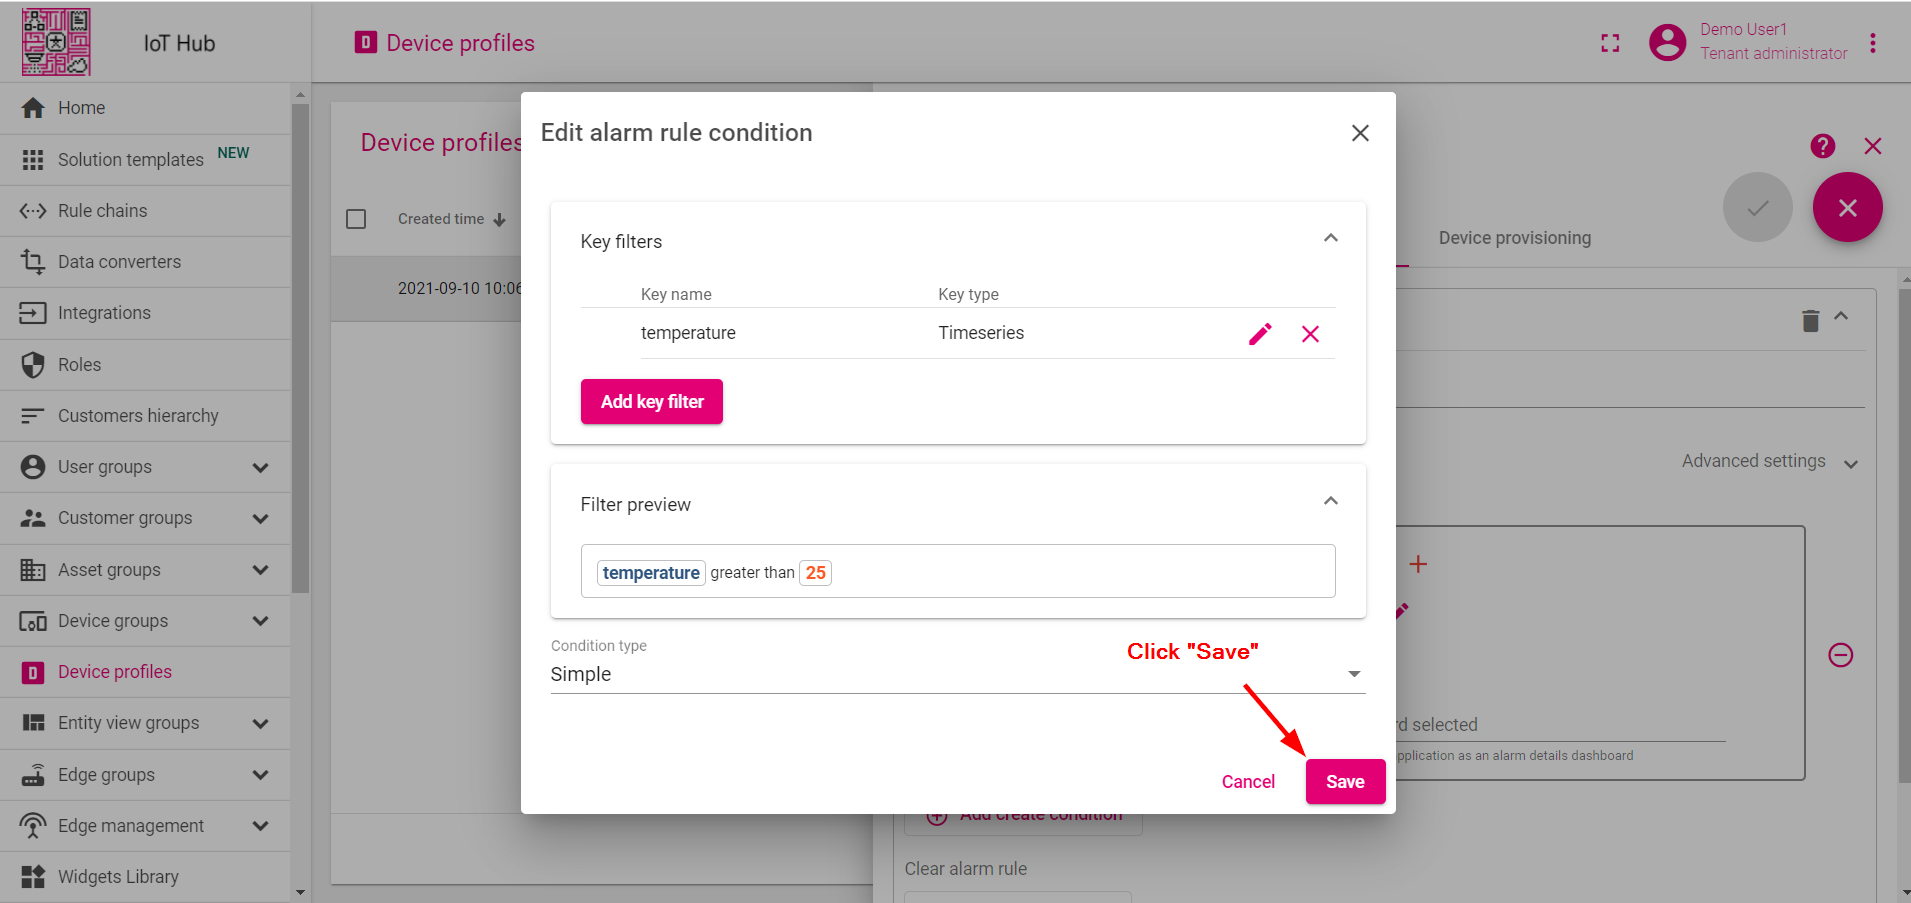
- Click "Save".
- Finally, click "Apply changes".
Step 5. Create alarm
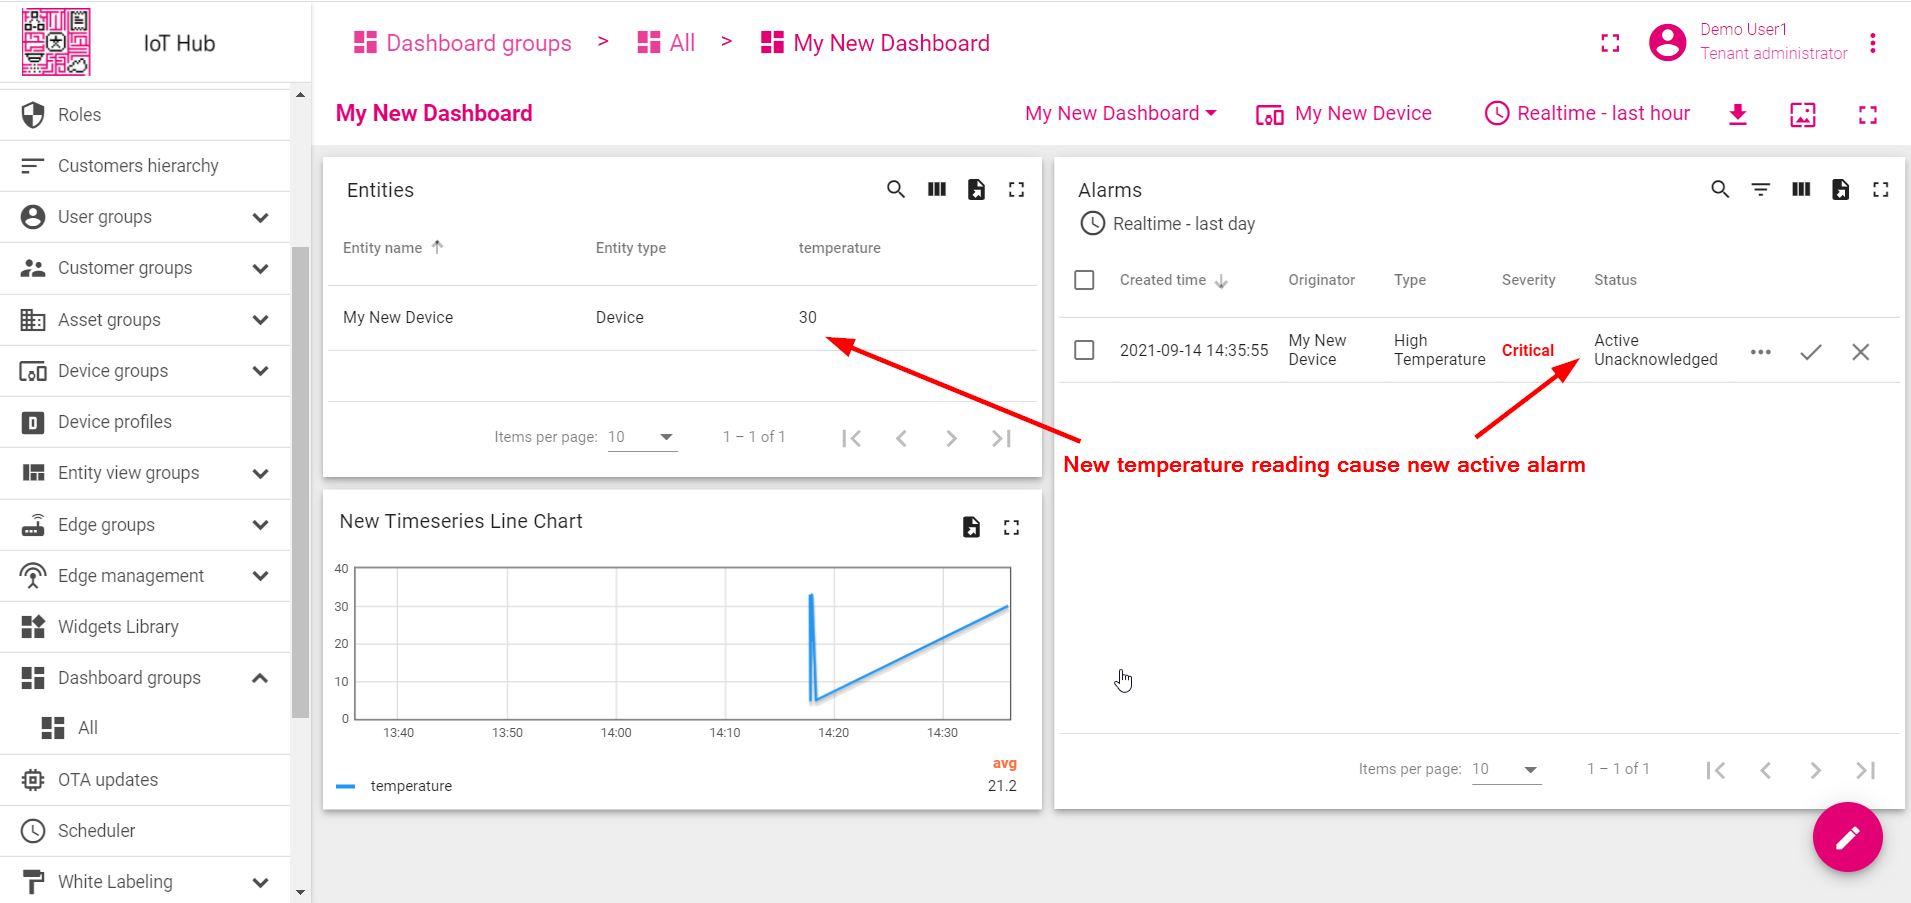
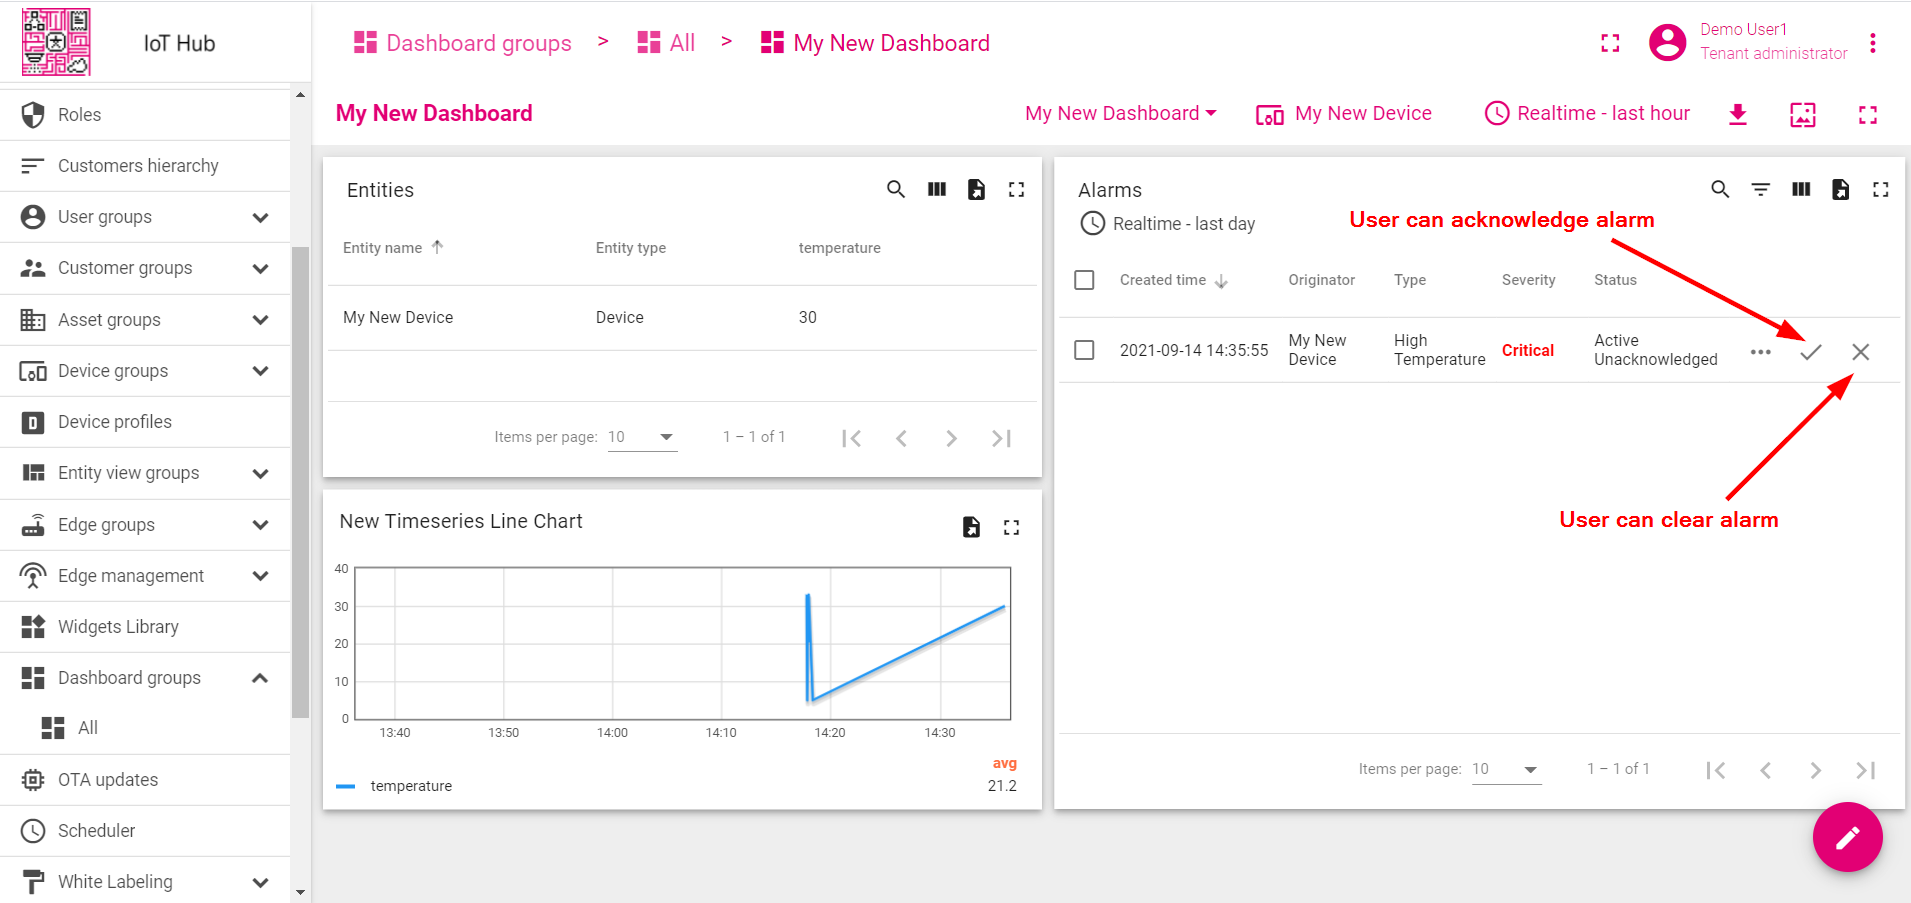
Now our alarm rule is active (see Step 4), and we should send new telemetry on behalf of the device (see Step 2) to trigger the alarm. Note that the temperature value should be 26 or higher to raise the alarm. Once we send new temperature reading, we should immediately see a new alarm on our dashboard.
- Notice that the new temperature telemetry causes a new active alarm.
- User may acknowledge and clear the alarms.
Step 6. Alarm notifications
It is quite easy to configure email or sms notifications for alarms. We recommend reviewing alarm rule examples and documentation about alarm notifications.
Note: You may integrate SMS/EMAIL using REST API call node.
Step 7. Share dashboard with customers
One of the most important IoT Hub features is the ability to create end-user dashboards. Each Customer User should see his own devices and should not be able to see devices or any other data that belongs to a different customer.
We have already created a Device (see Step 1), and a Dashboard (see Step 3). Now it’s time to create a Customer and a Customer User and make sure they will have access to the device’s data and to the dashboard. There are two options how Tenant Administrator can give access to certain Entity (Device, Dashboard, Asset, etc.) for a Customer:
- A. Make Customer become the owner of the entity. This option is useful to ensure that only this customer can access the device and its data (see Step 7.2).
- B. Share the entity with the Customer. This option is useful to share a single dashboard with multiple customers (see Step 7.3).
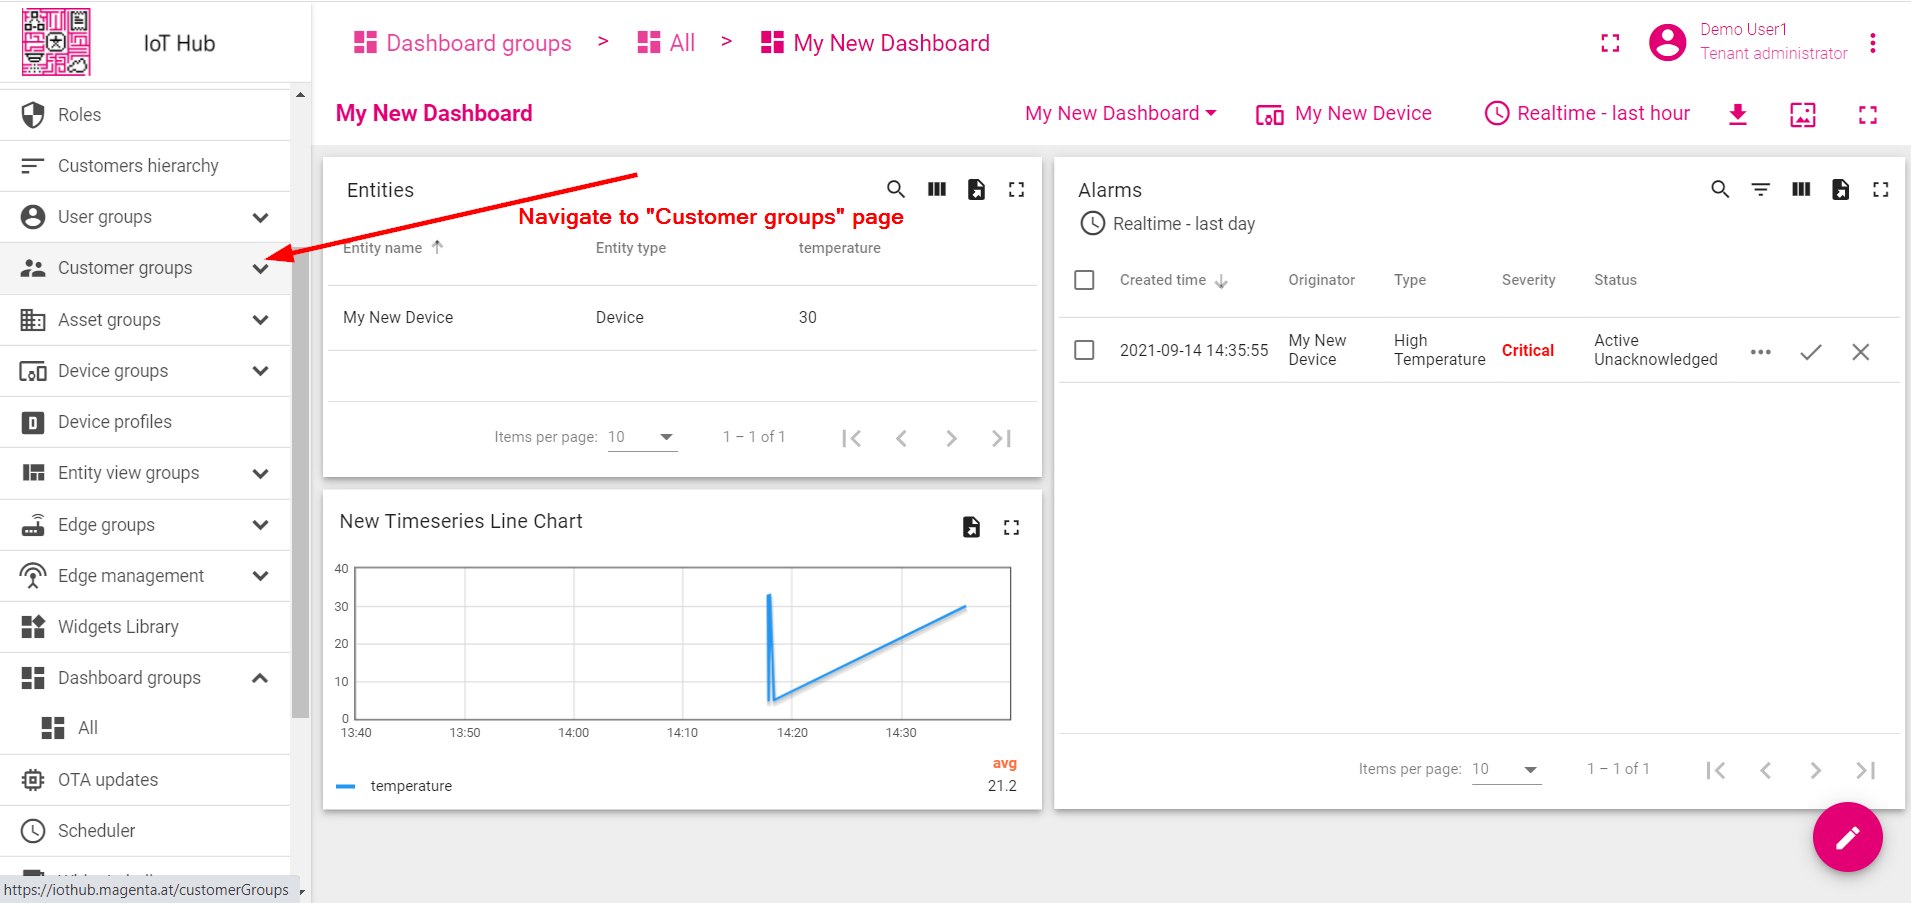
Step 7.1 Create customer
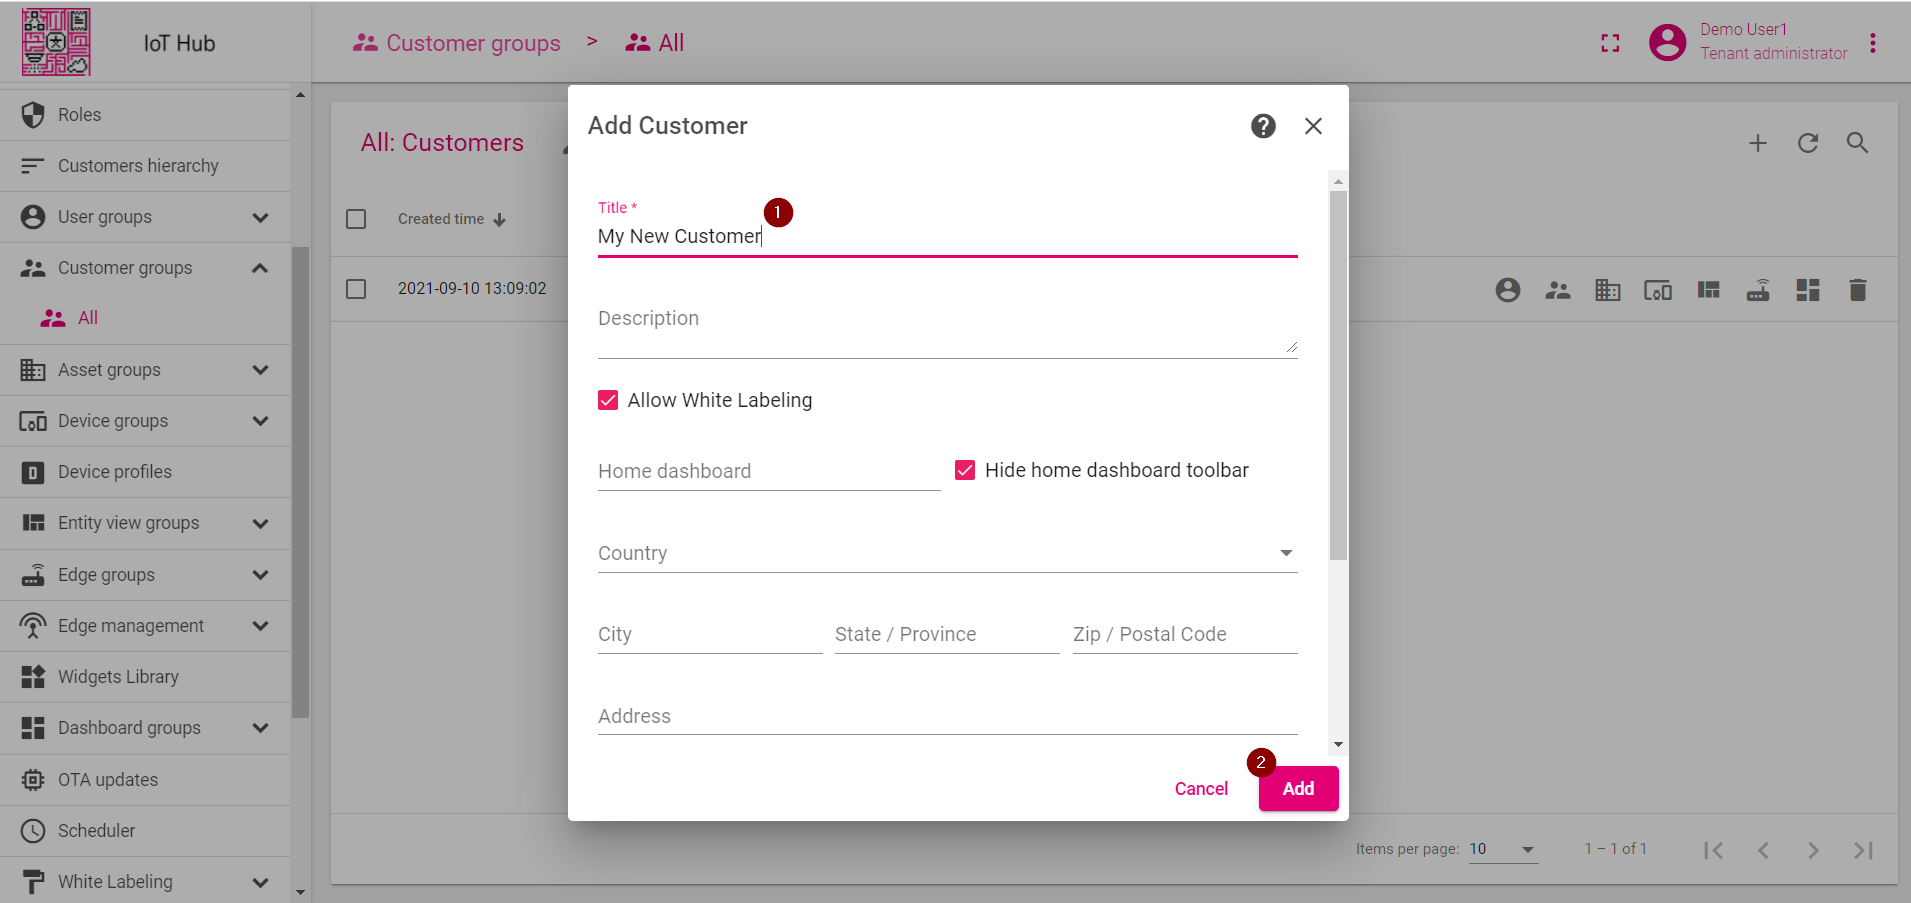
Let’s create a customer with title “My New Customer”. Please see instruction below:
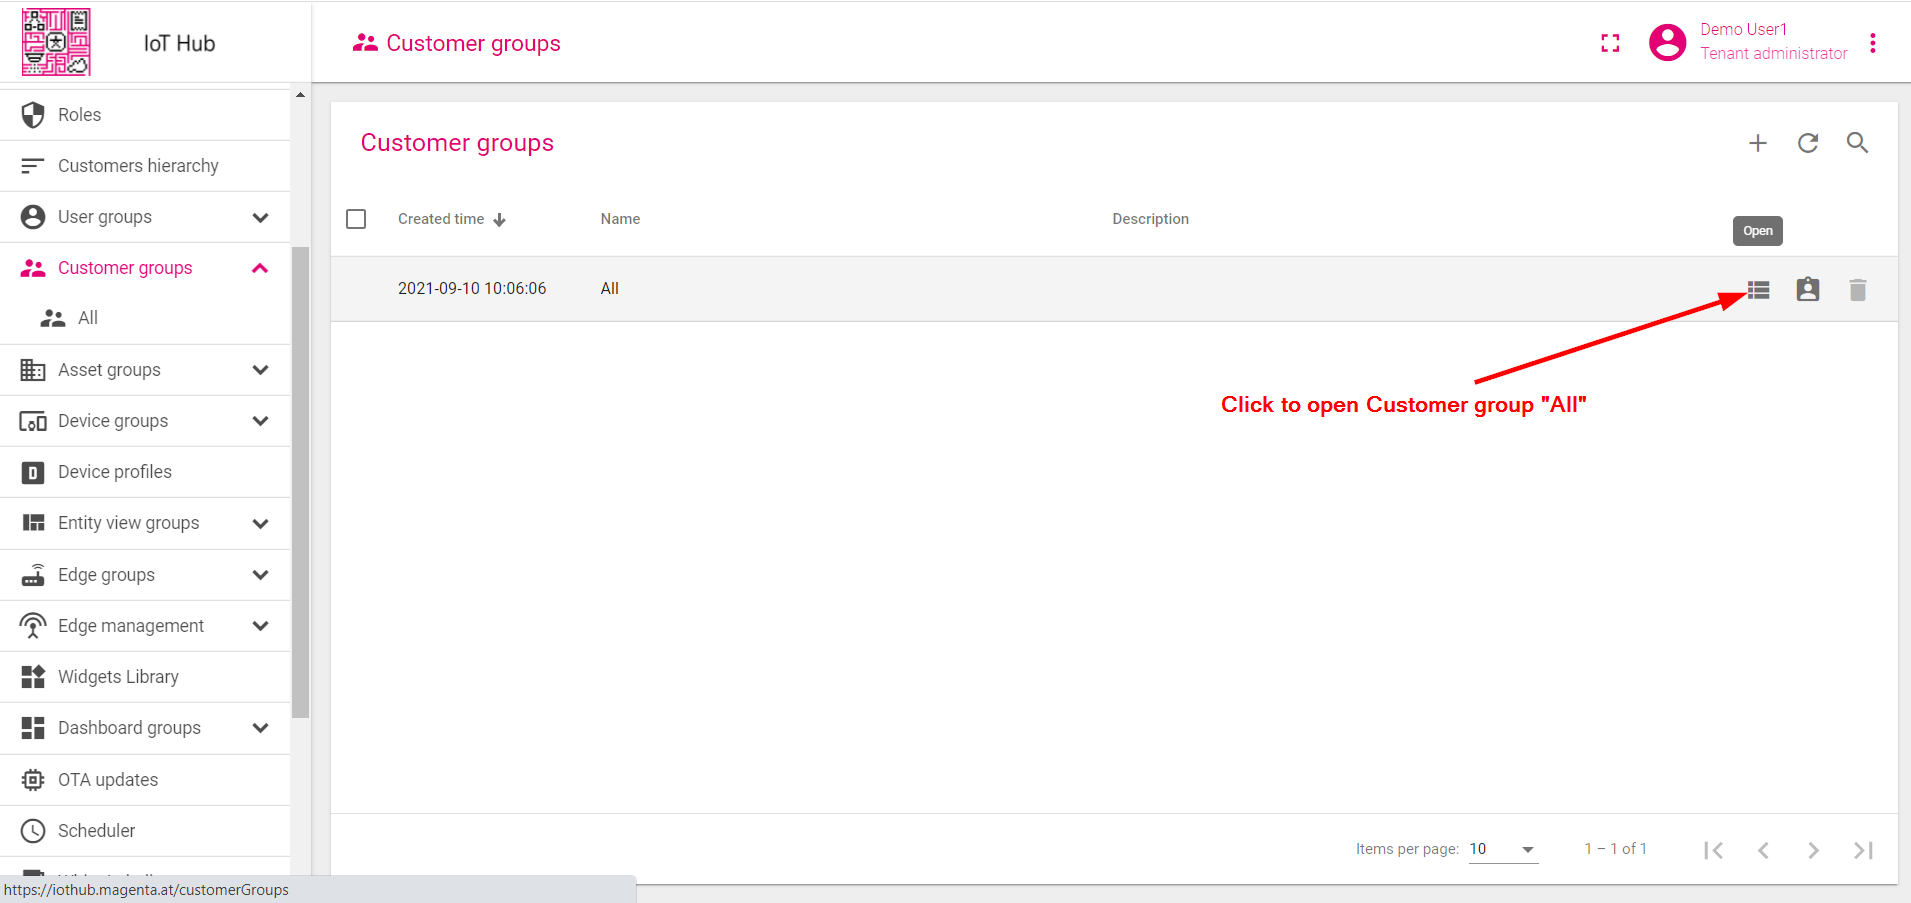
- Navigate to the customer groups page.
- Then navigate to the default customer group "All".
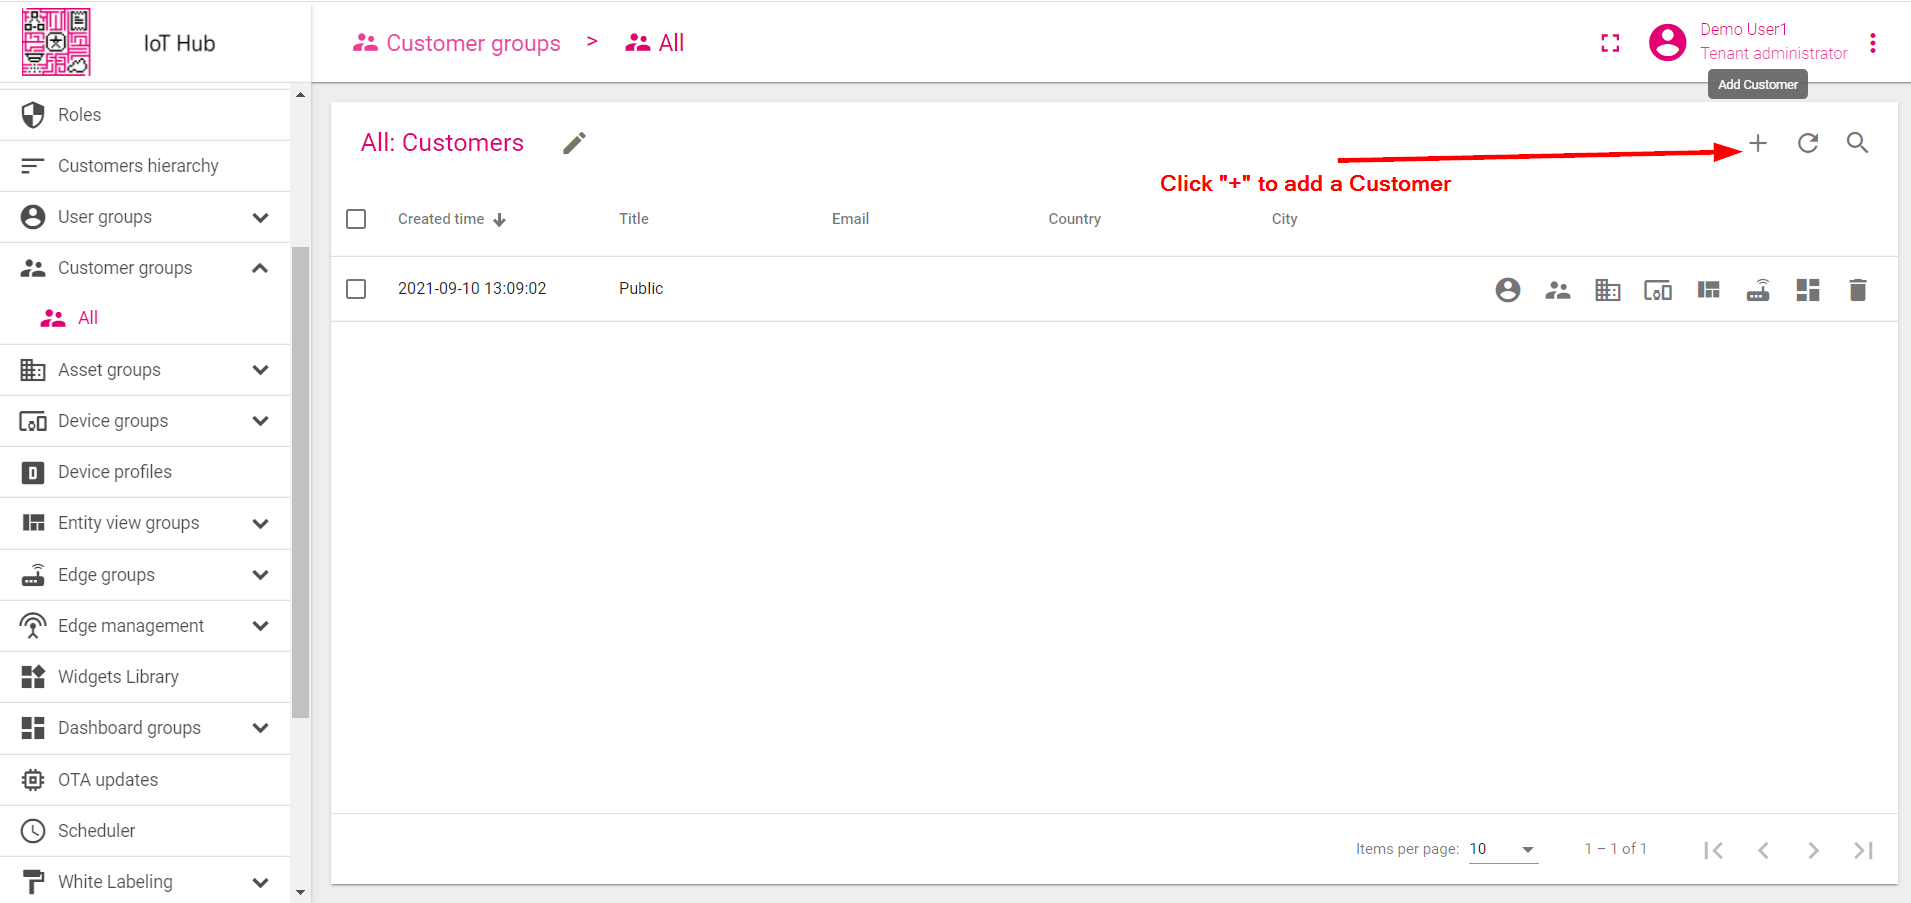
- Click the "+" sign to add a customer.
- Add customer title and click "Add".
Step 7.2 Change owner of the device
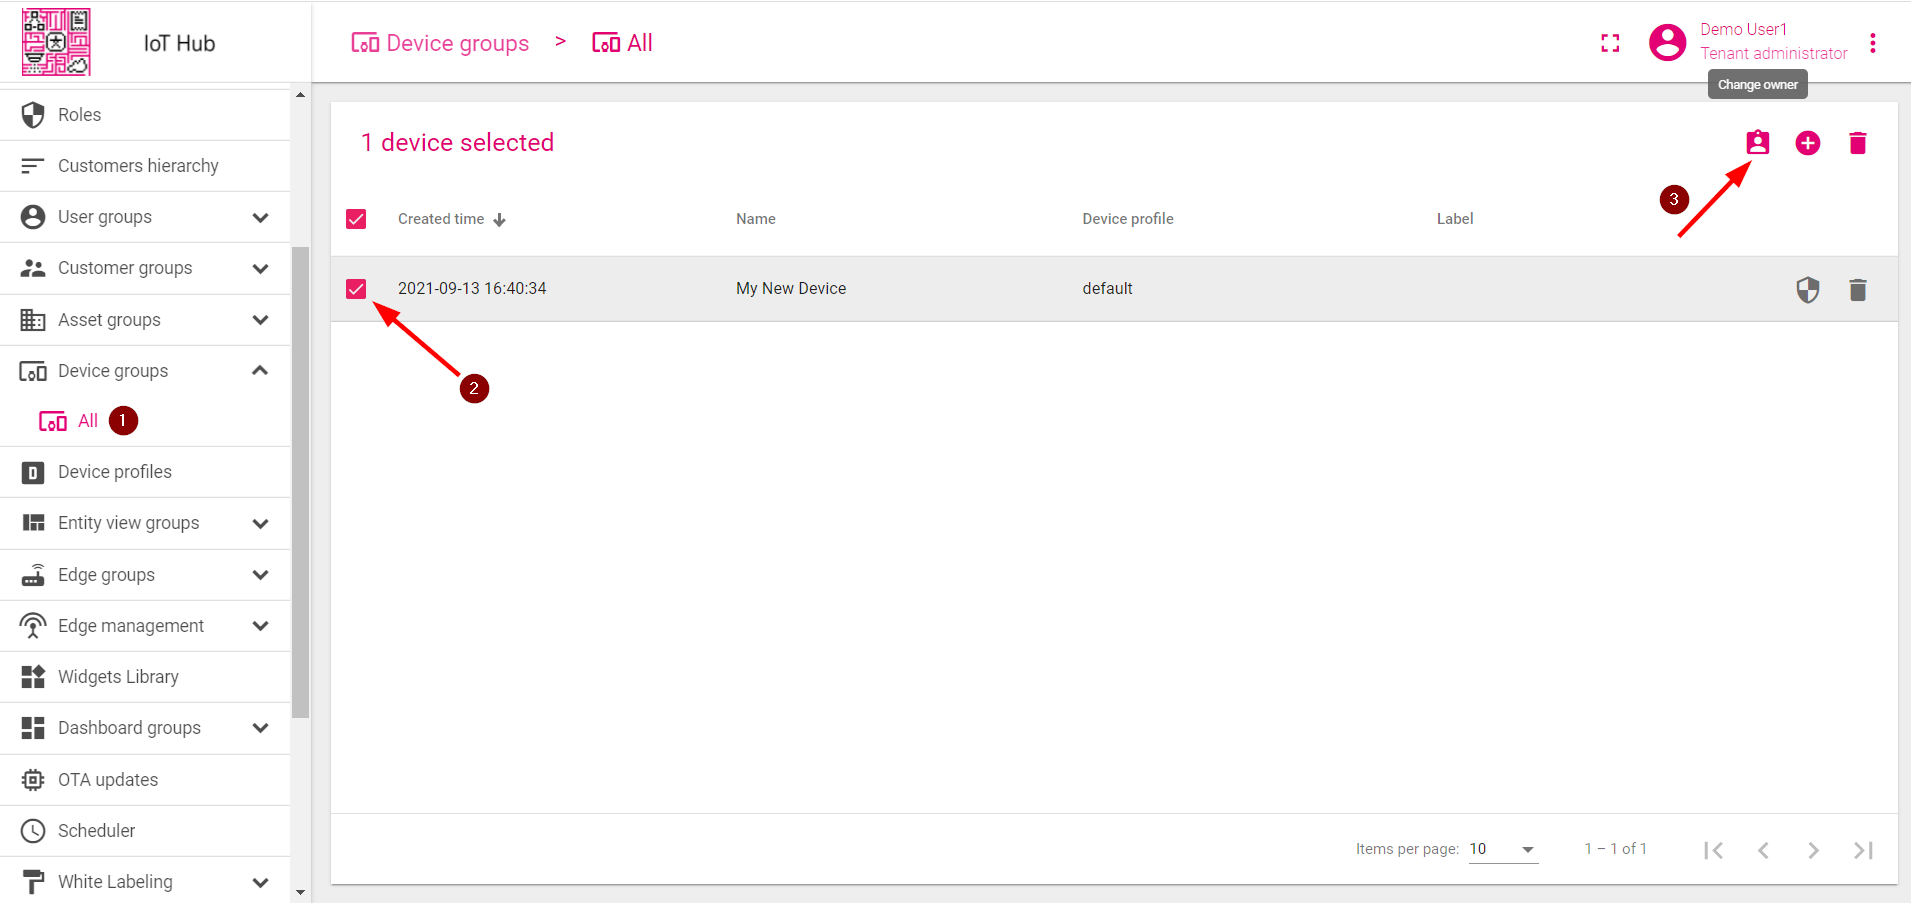
Let’s make Customer become the owner of the device.
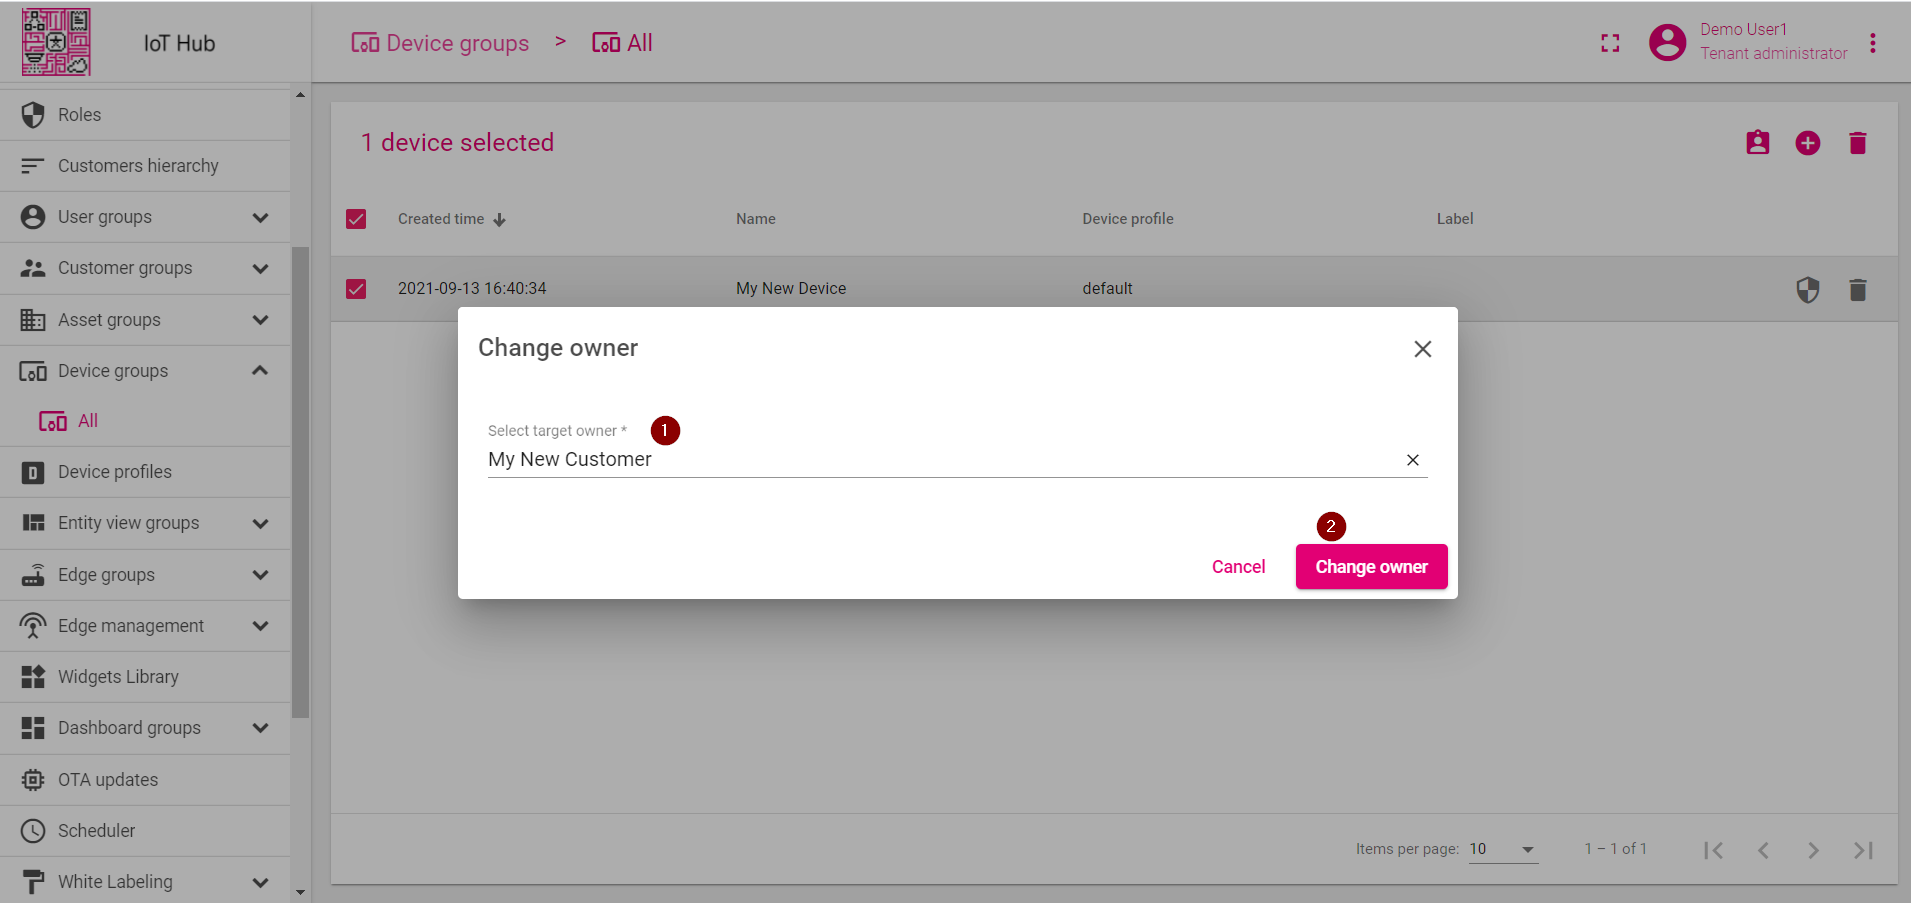
- Select your device and click the "Change Owner" button.
- Start typing the customer name and then click on the customer item, then click the "Change owner" button.
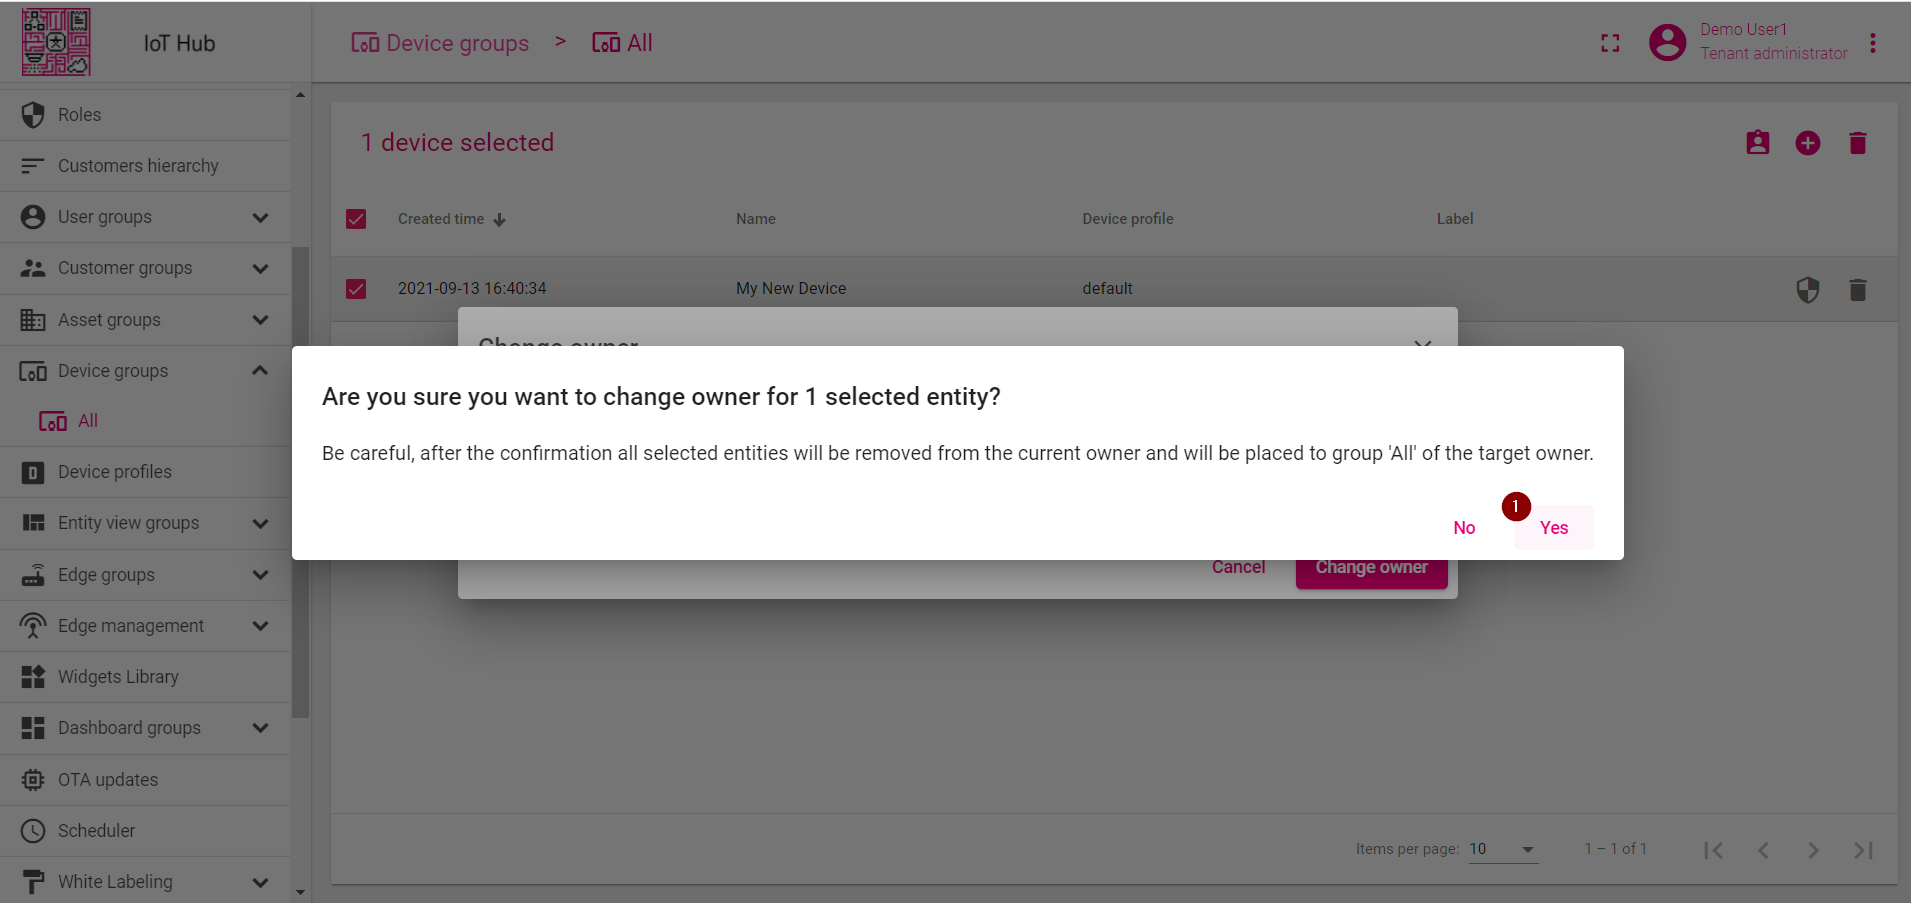
- Click "Yes". You can always change the owner back to the tenant.
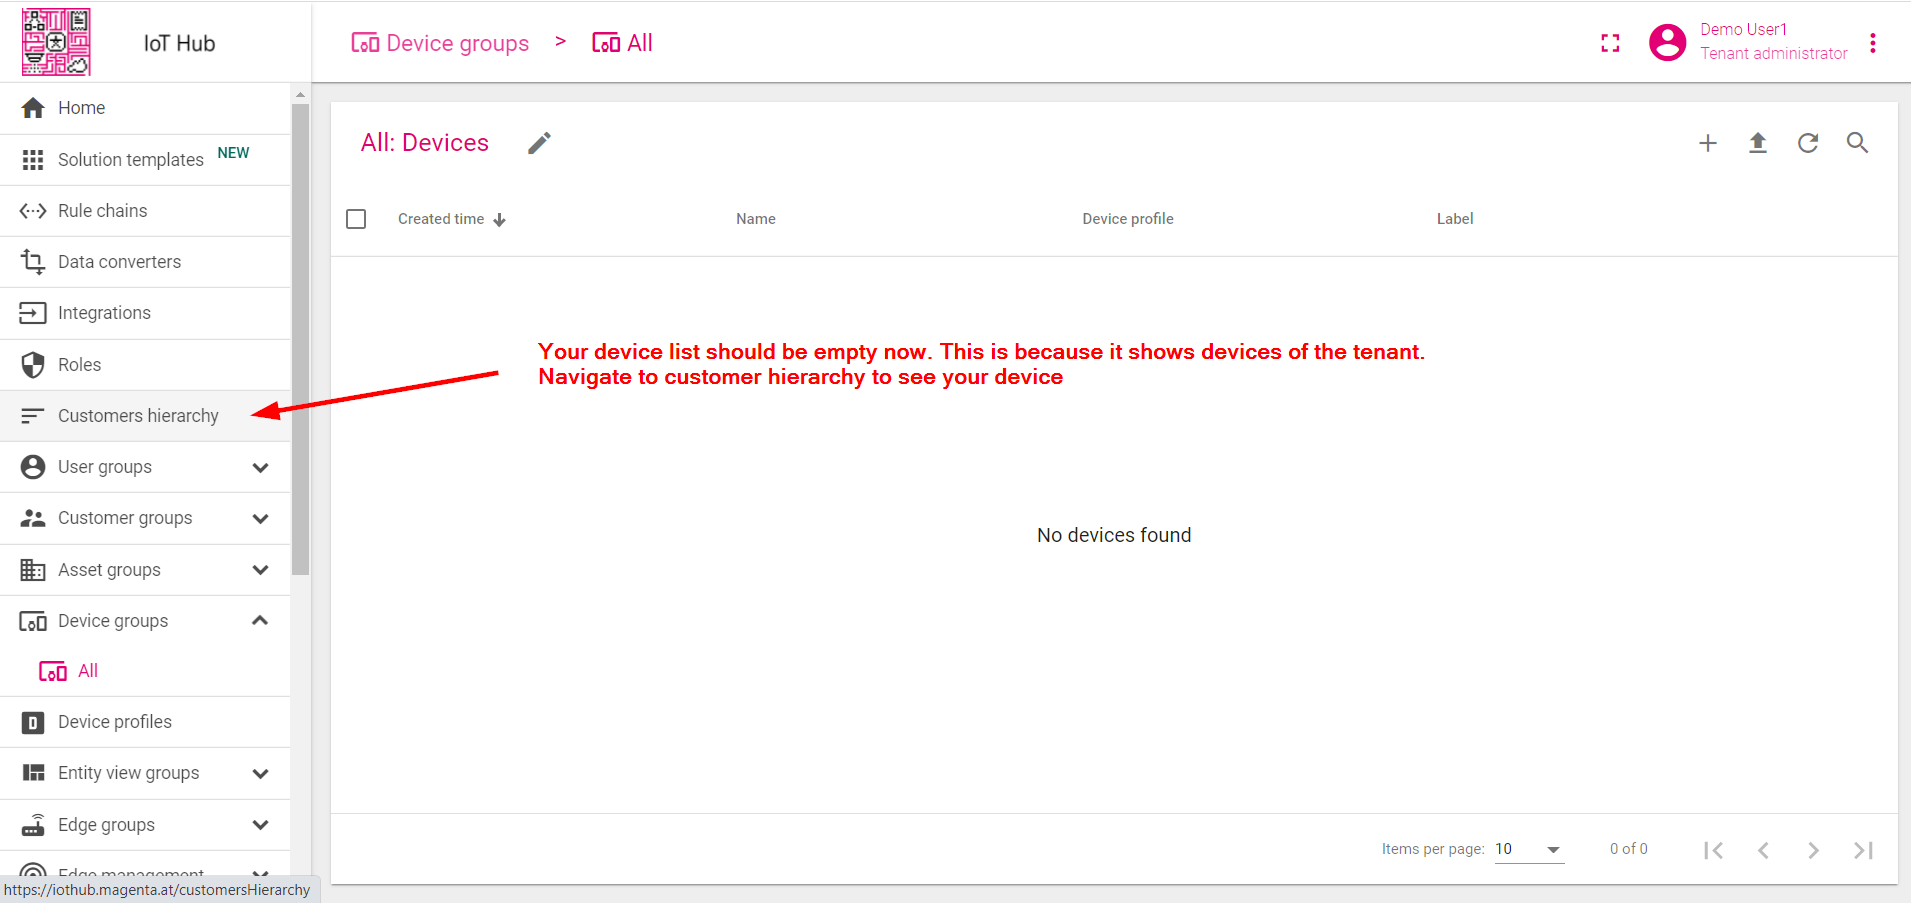
- Your device list should be empty now. This is because it displays the devices of the tenant. Navigate to the customer hierarchy to see your device.
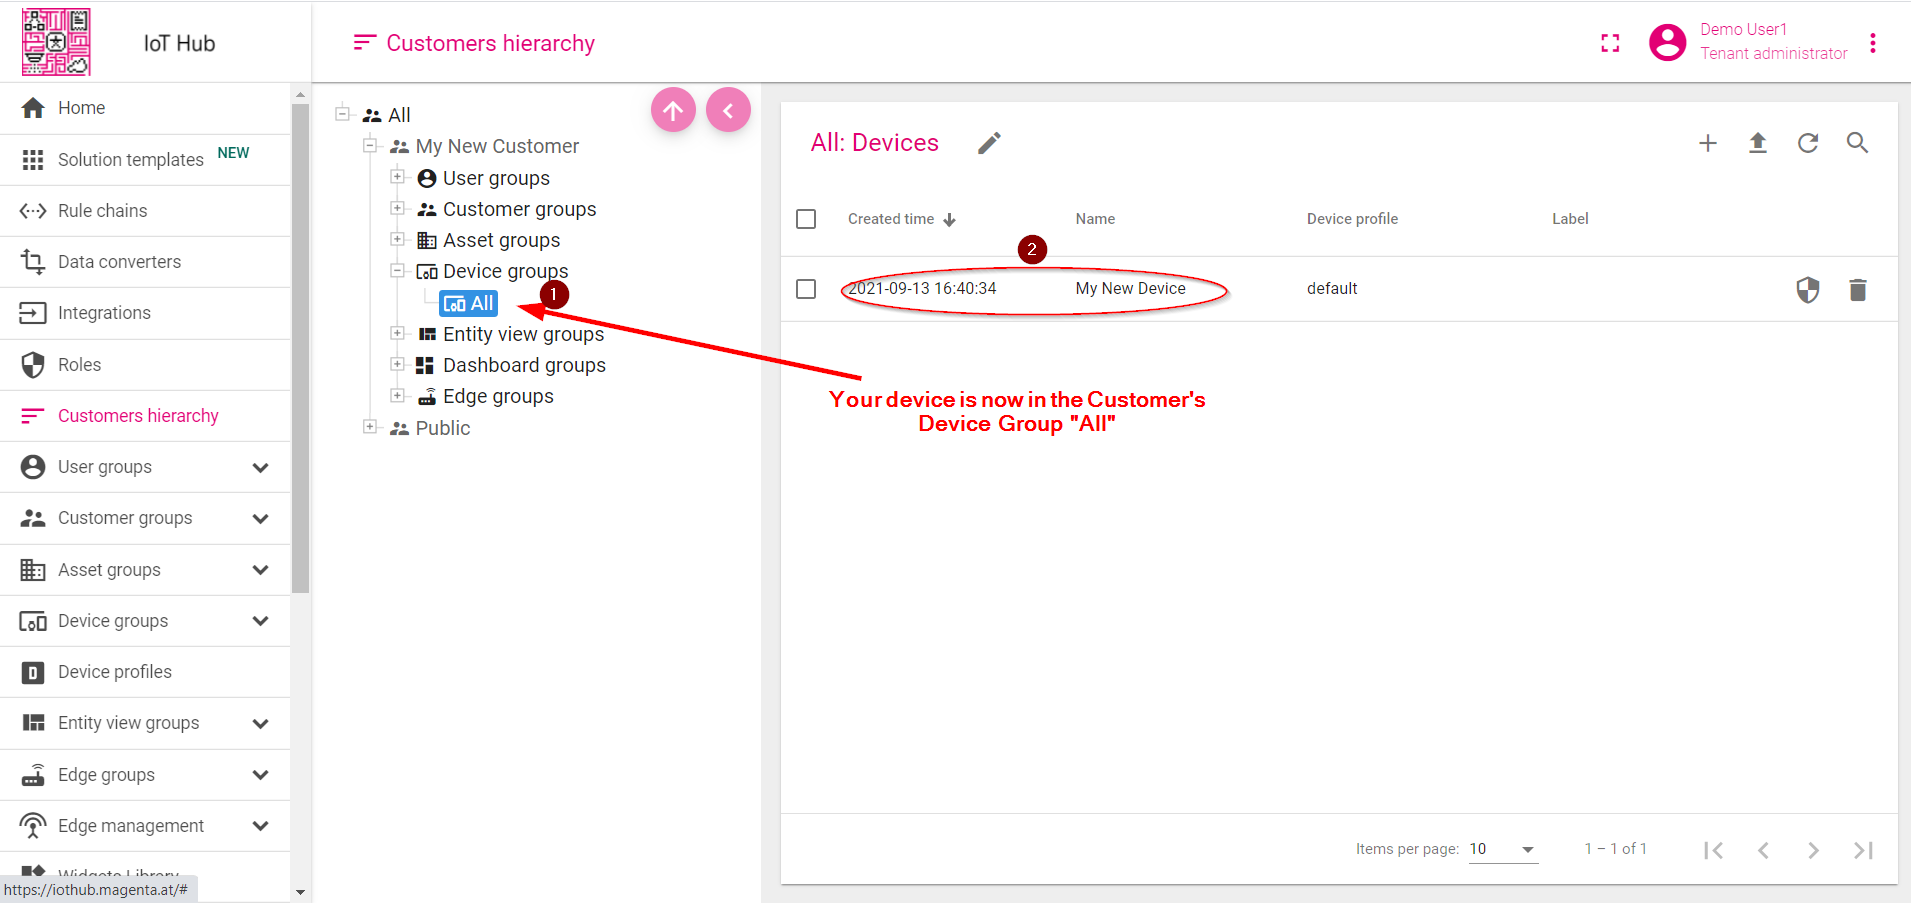
- Your device is now in the Customers group "All".
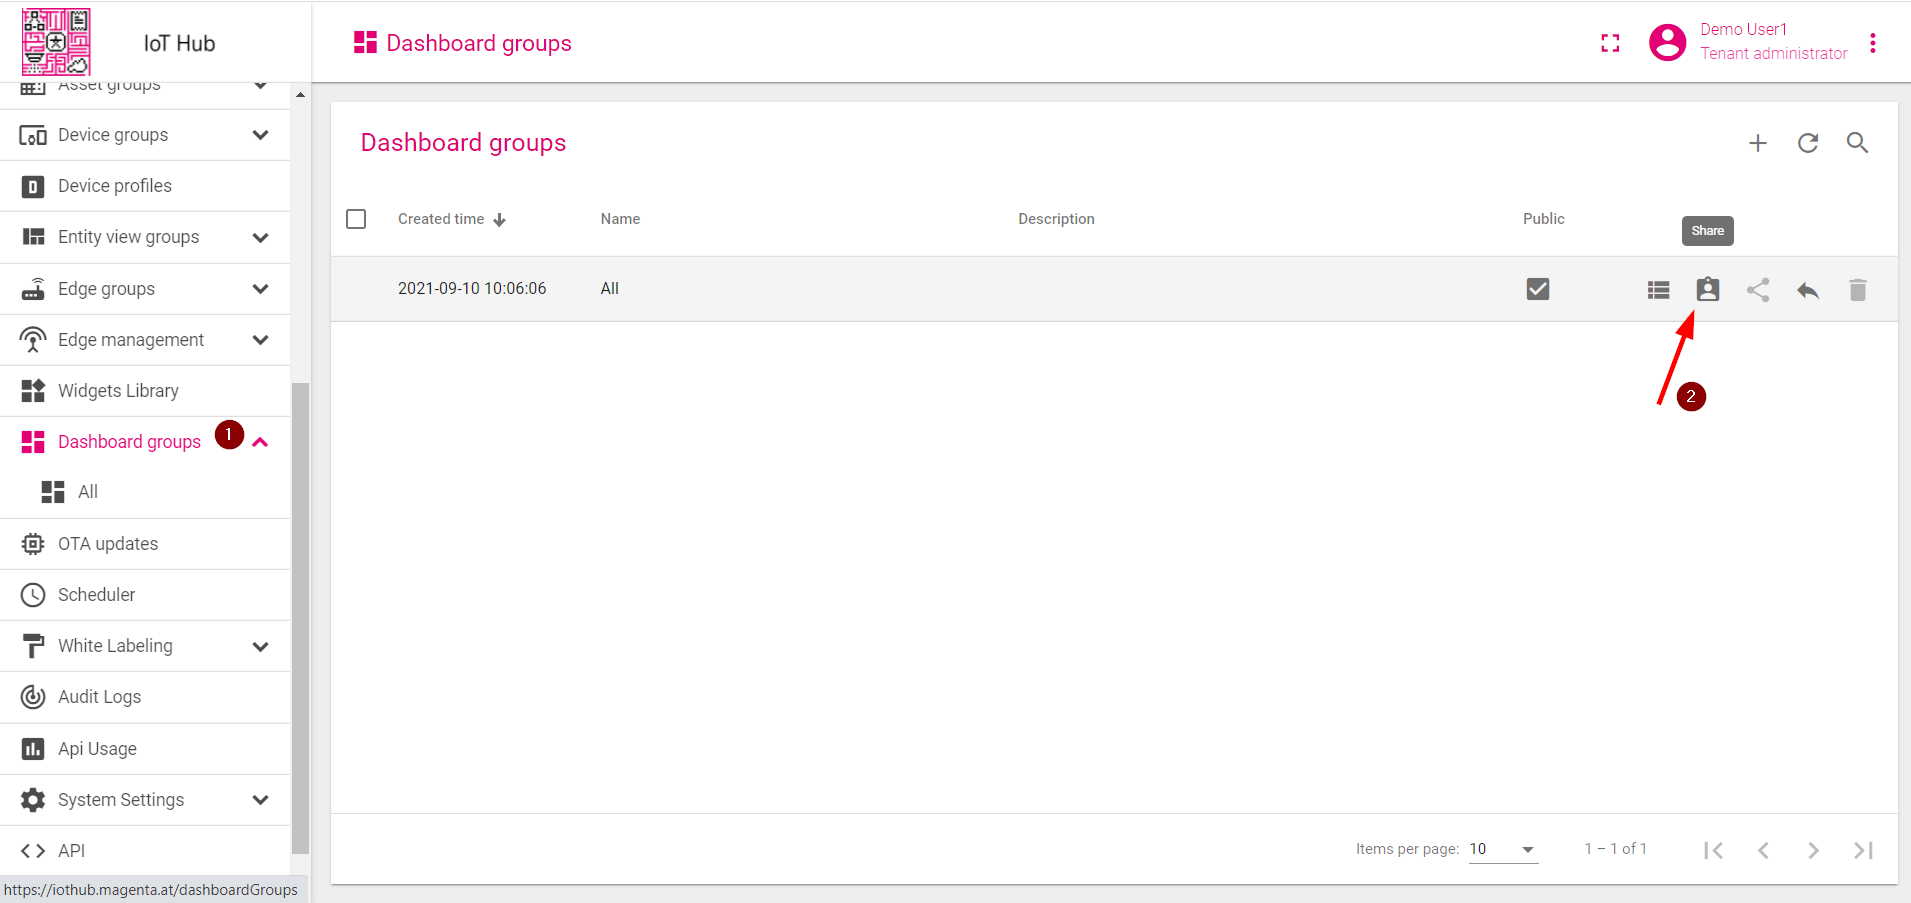
Step 7.3 Share the dashboard
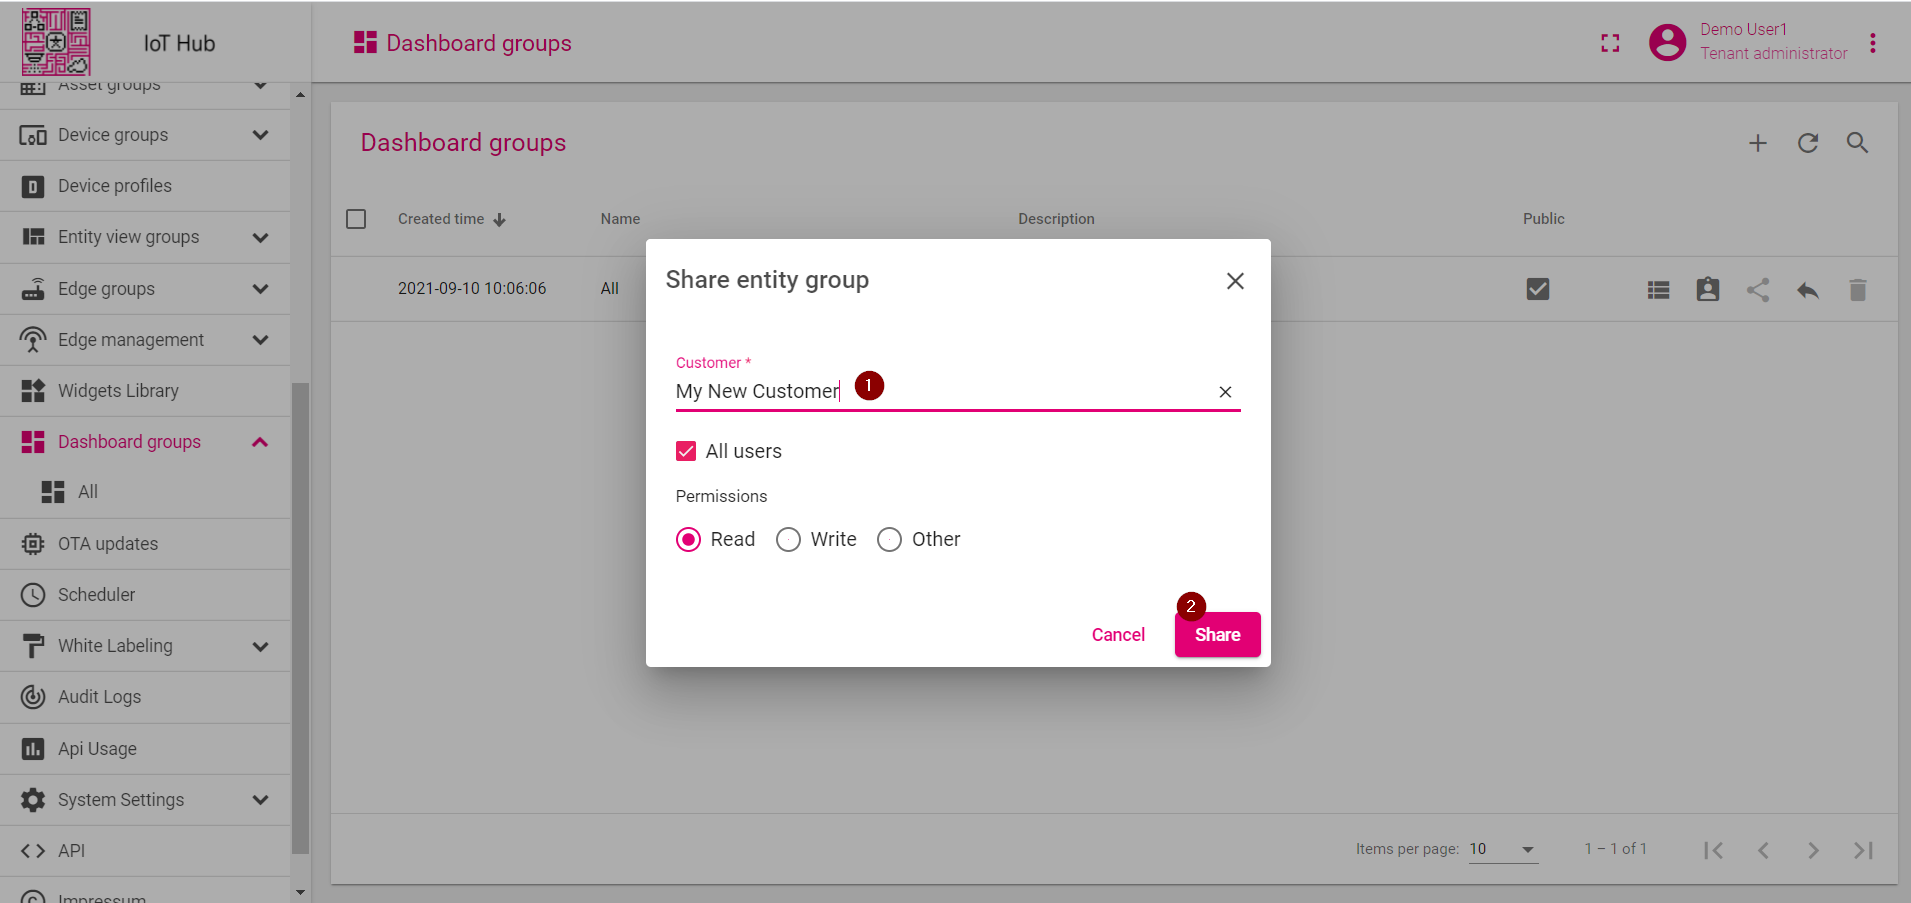
Let’s share our dashboard with the Customer. Our dashboard is in the group “All”. Ideally, we should create another dashboard group, but to simplify the guide, we will use the group “All”.
- Open "Dashboard Groups" and click the "Share" button.
- Select the customer and click "Share".
Step 7.4 Create customer user
Finally, let’s create a user that will belong to the customer and will have read-only access to the dashboard and the device itself. You may optionally configure the dashboard to appear just after the user login to the platform web UI.
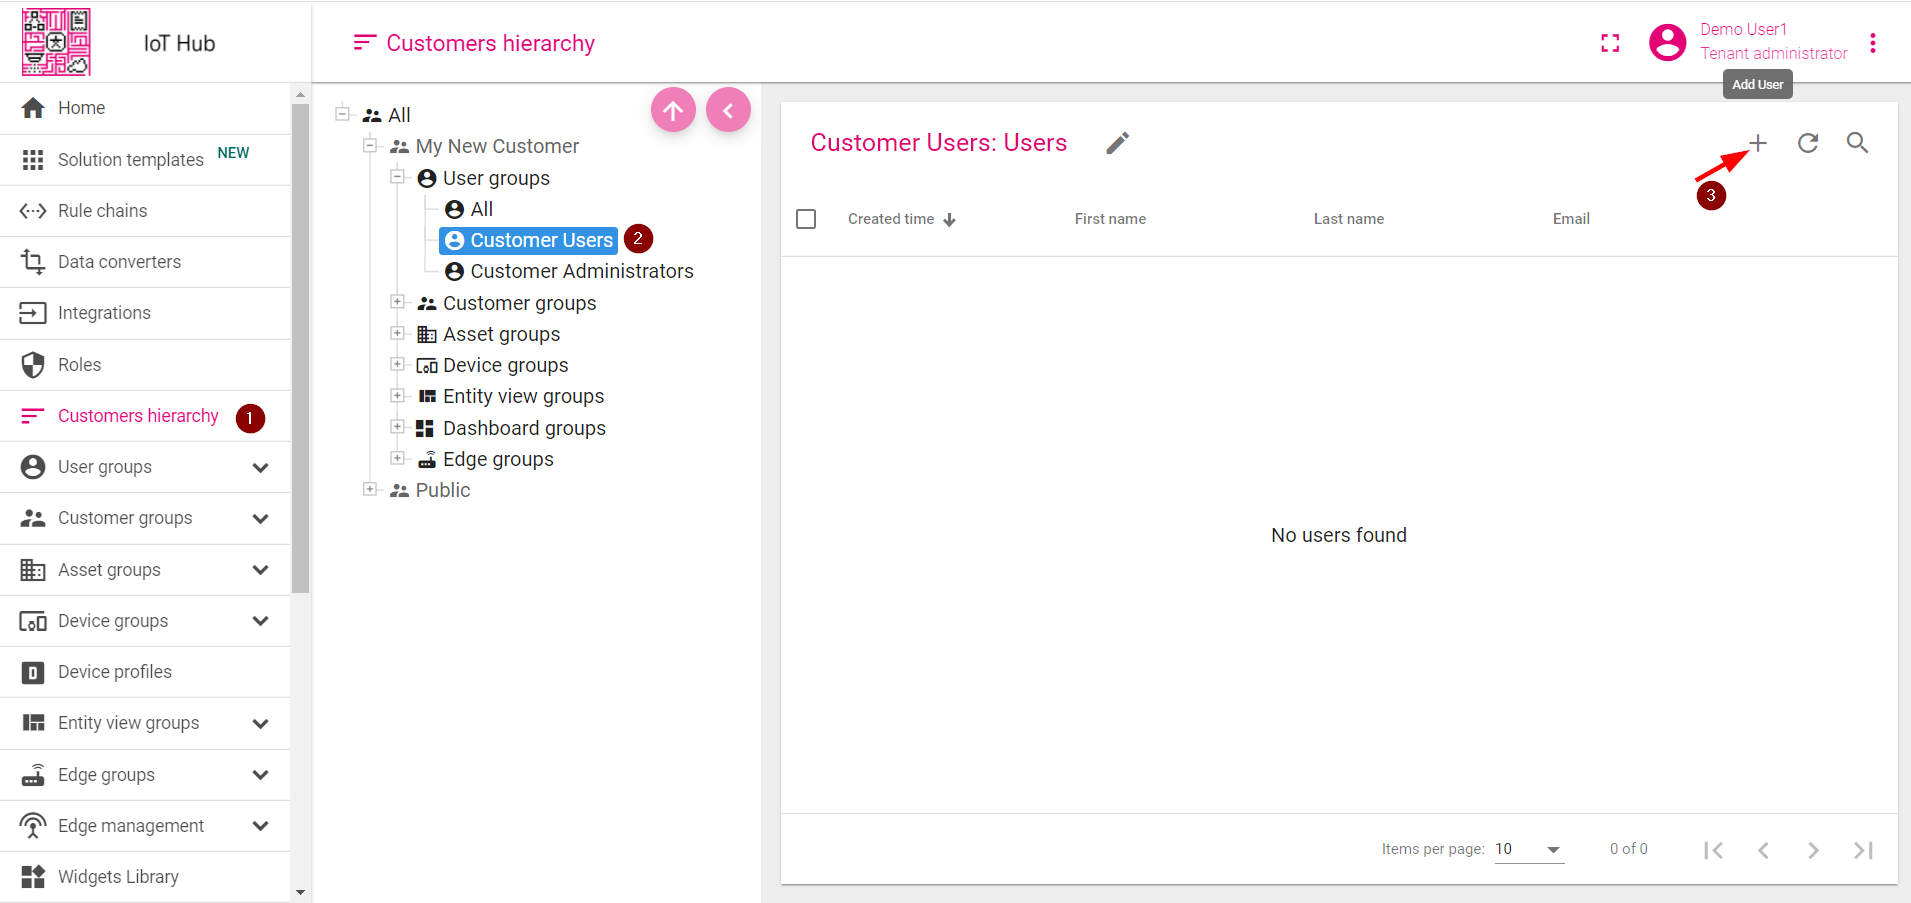
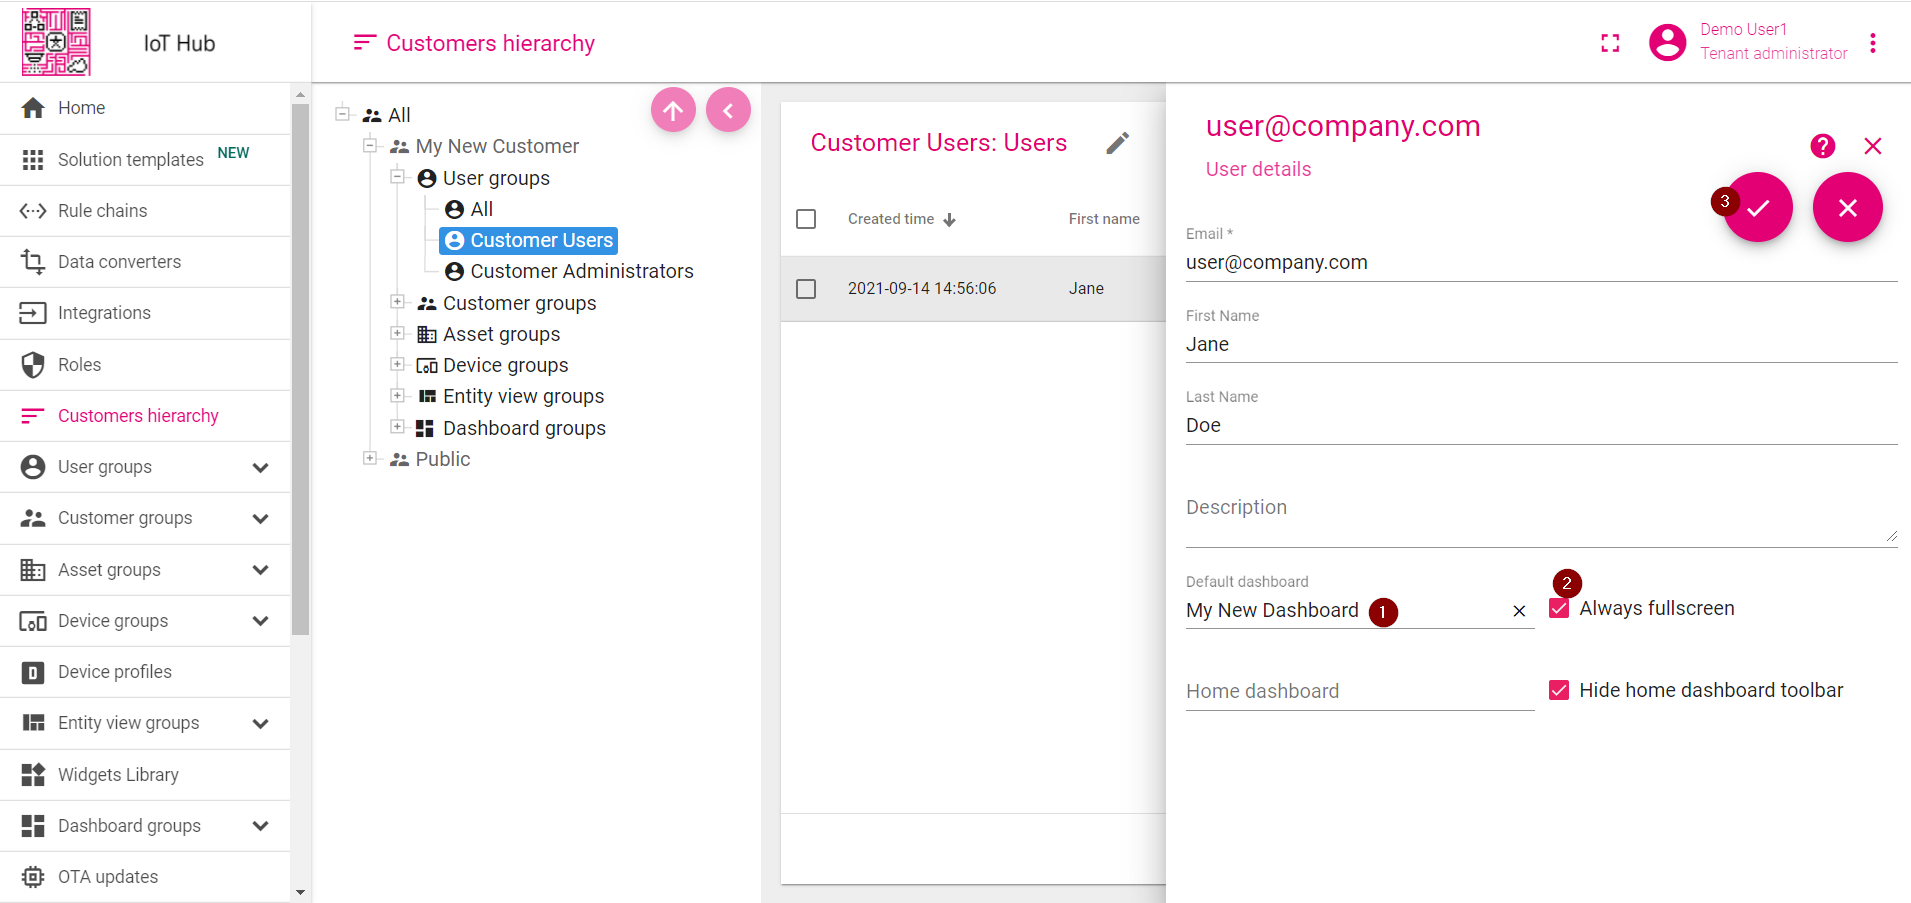
- Open "Customers hierarchy", select "Customer Users" and click "Add".
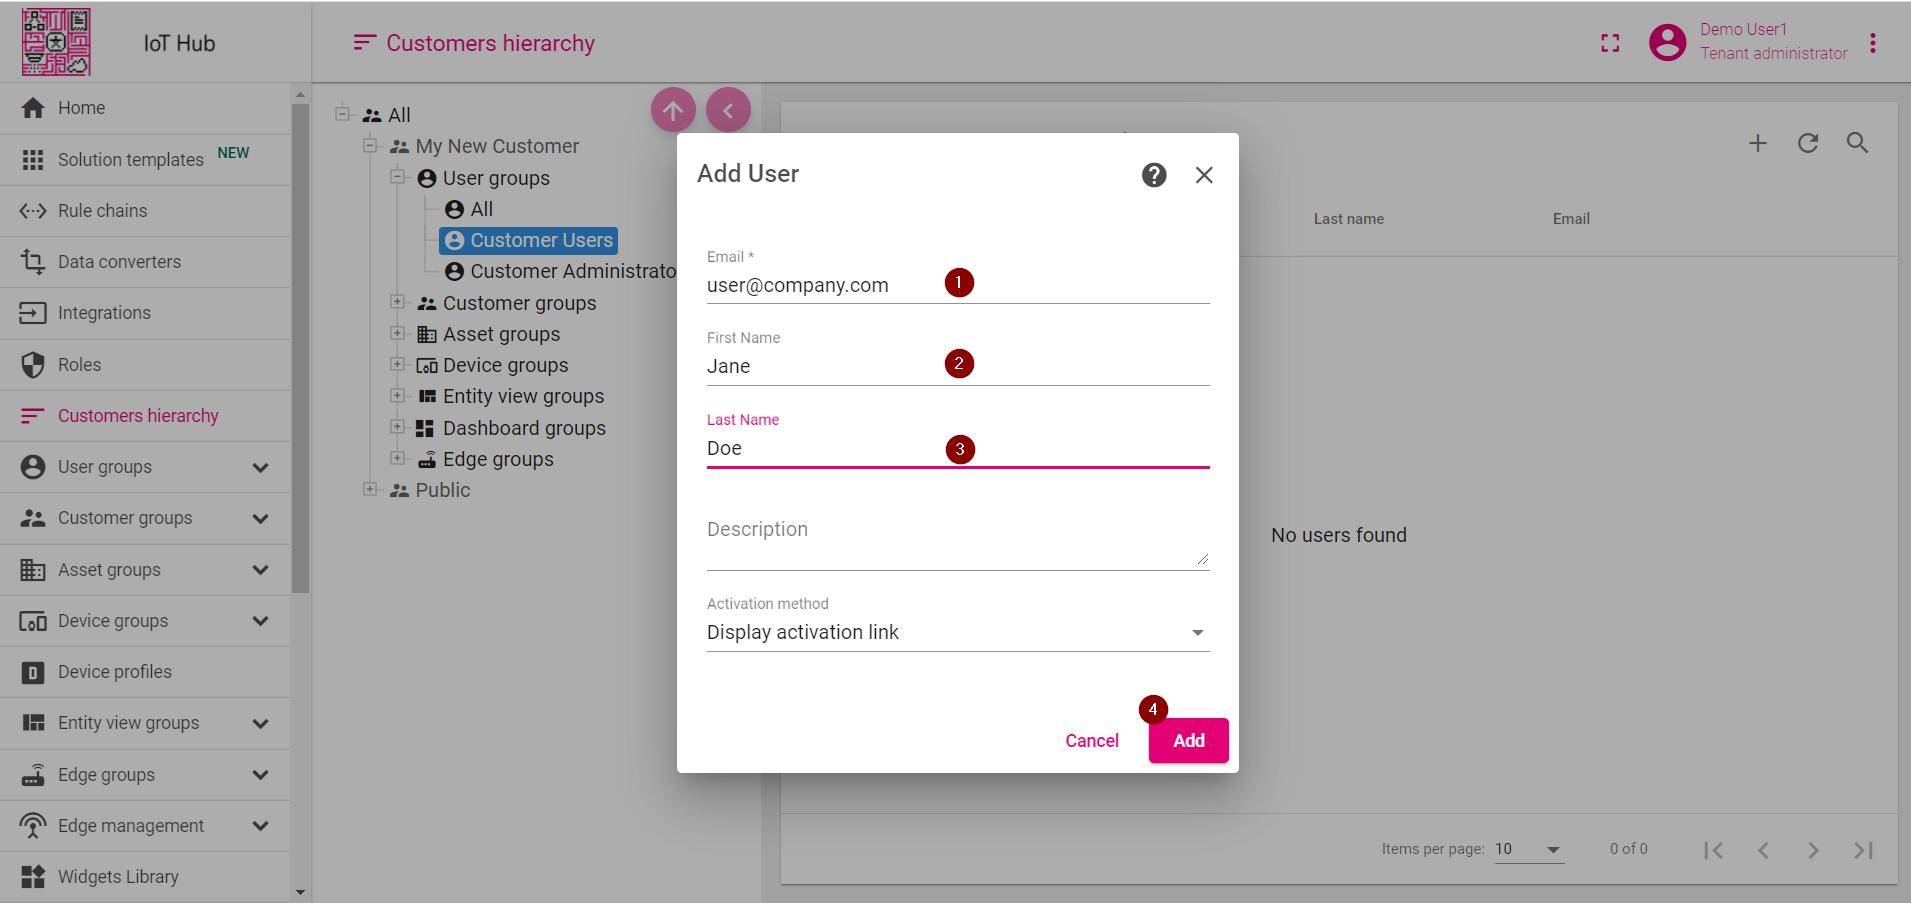
- Specify email, first and last name. Click "Add".
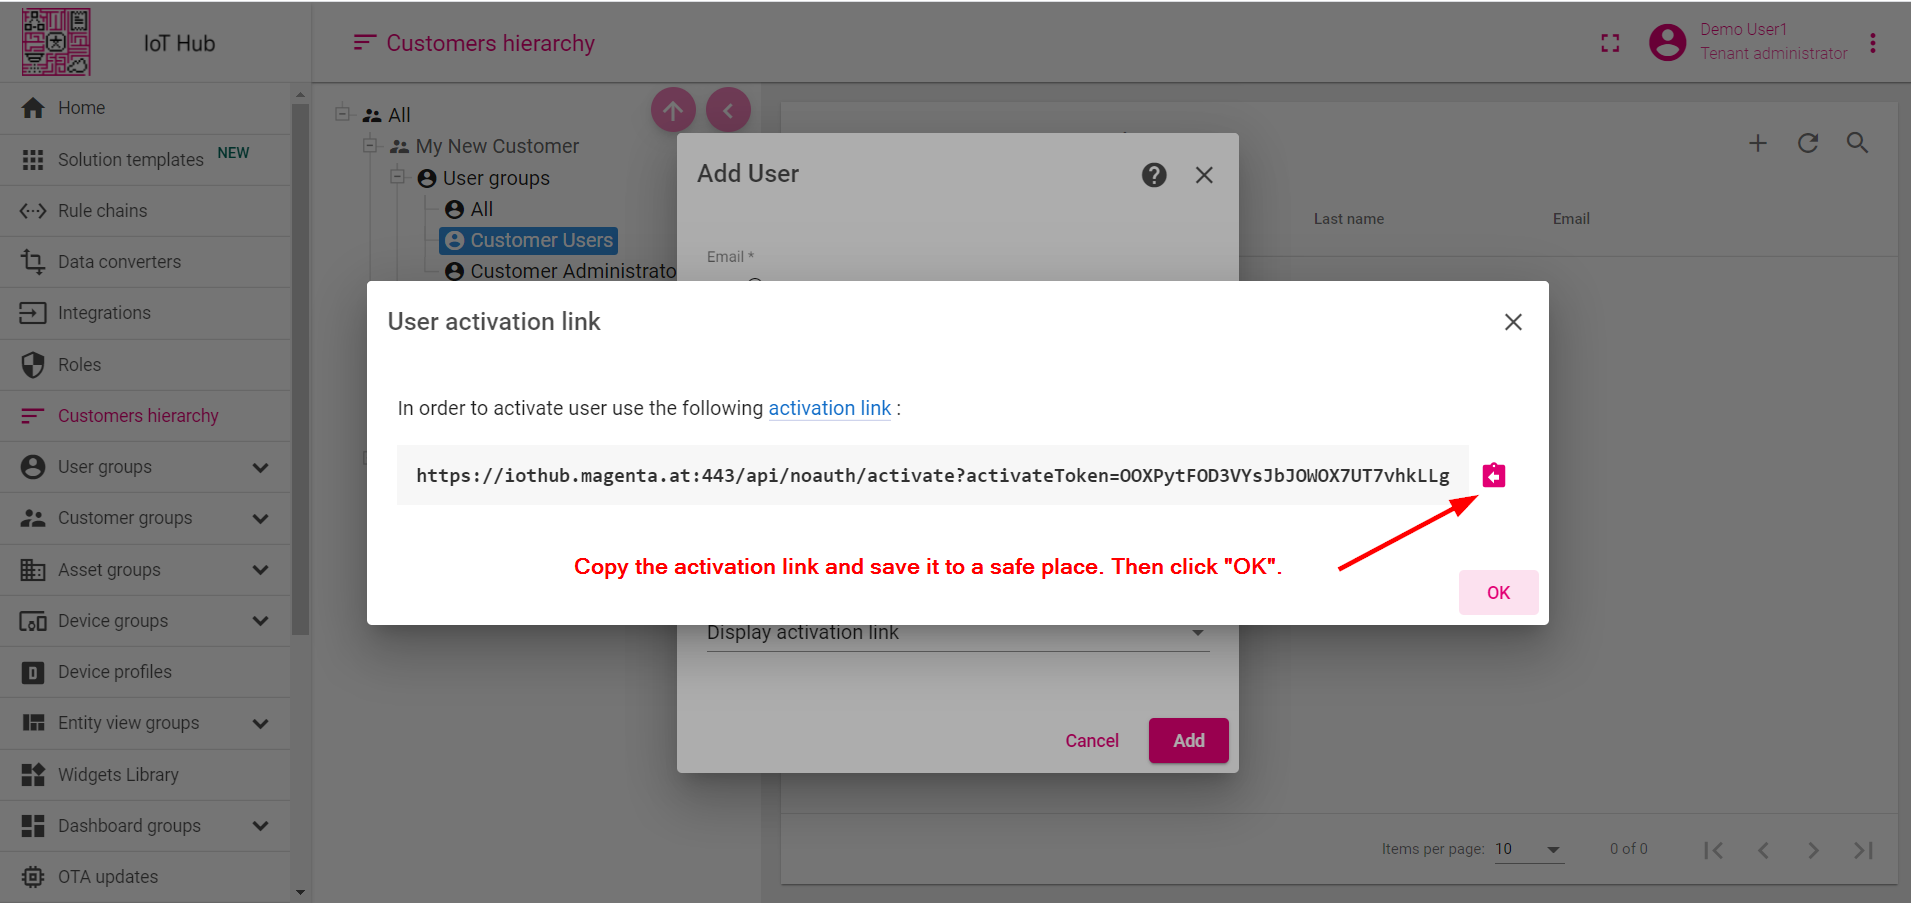
- Copy the activation link and save it to a safe place. Then click "OK".
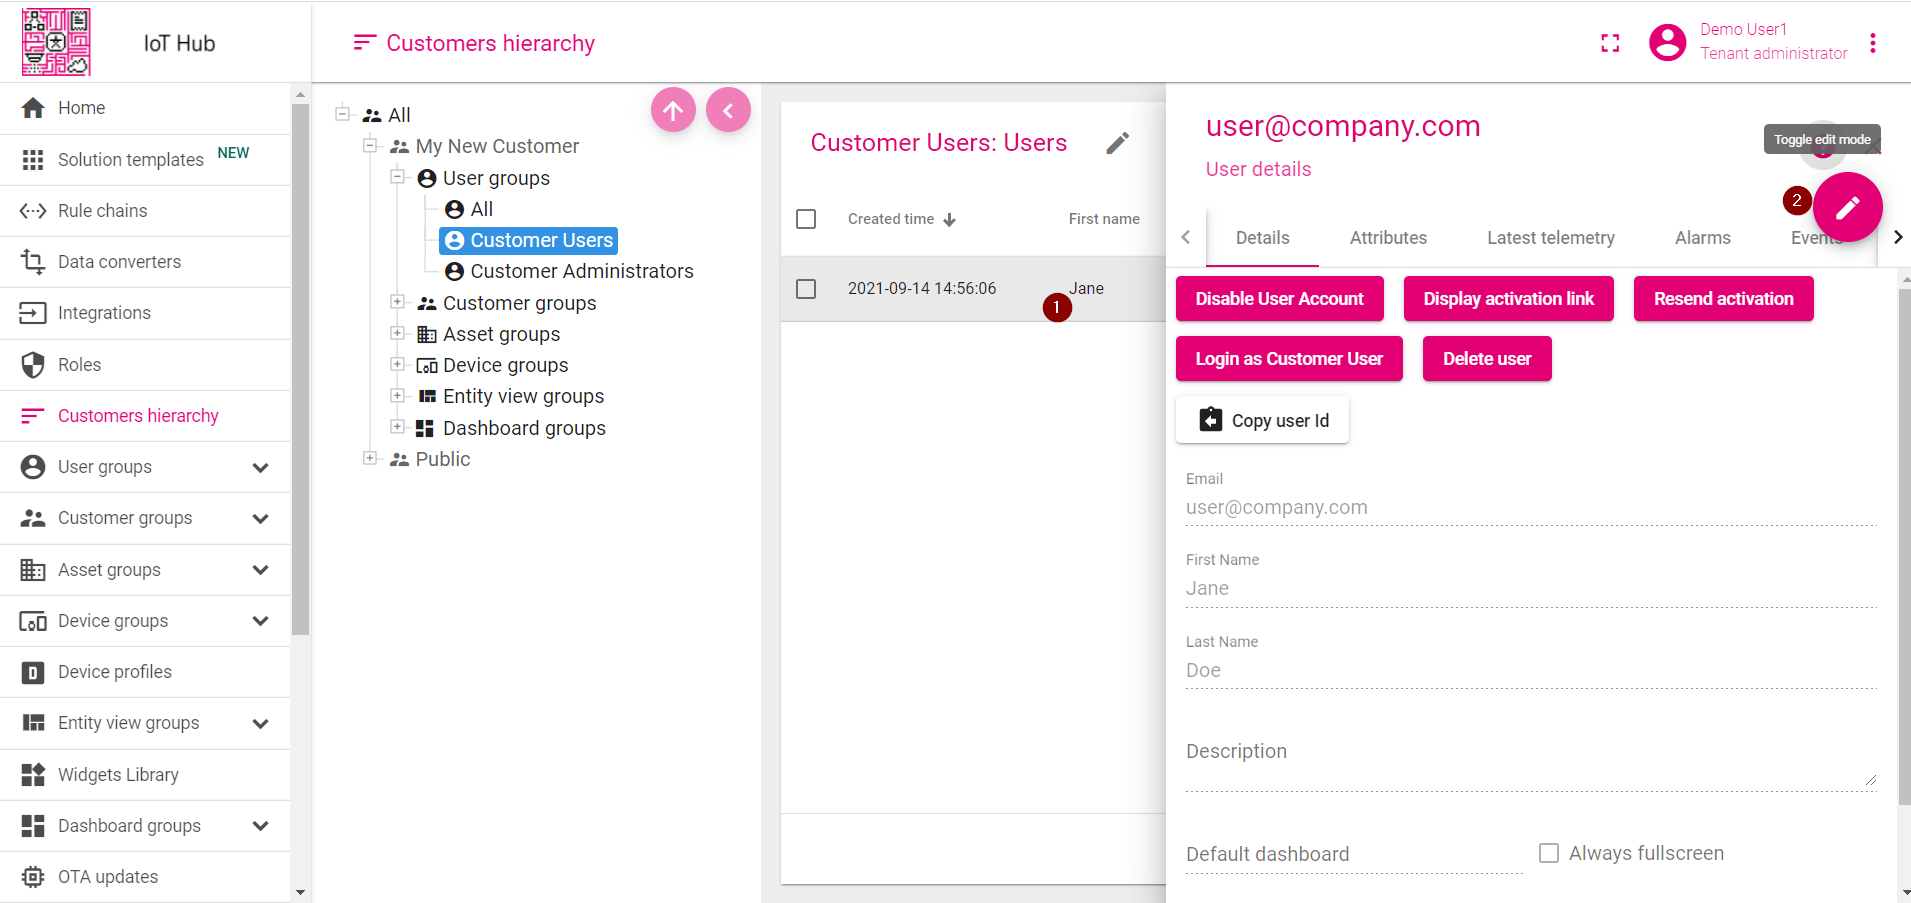
- Click on the user name to open user details. Toggle edit mode.
- Optionally, select the dashboard and enable "always fullscreen" mode. Apply changes.
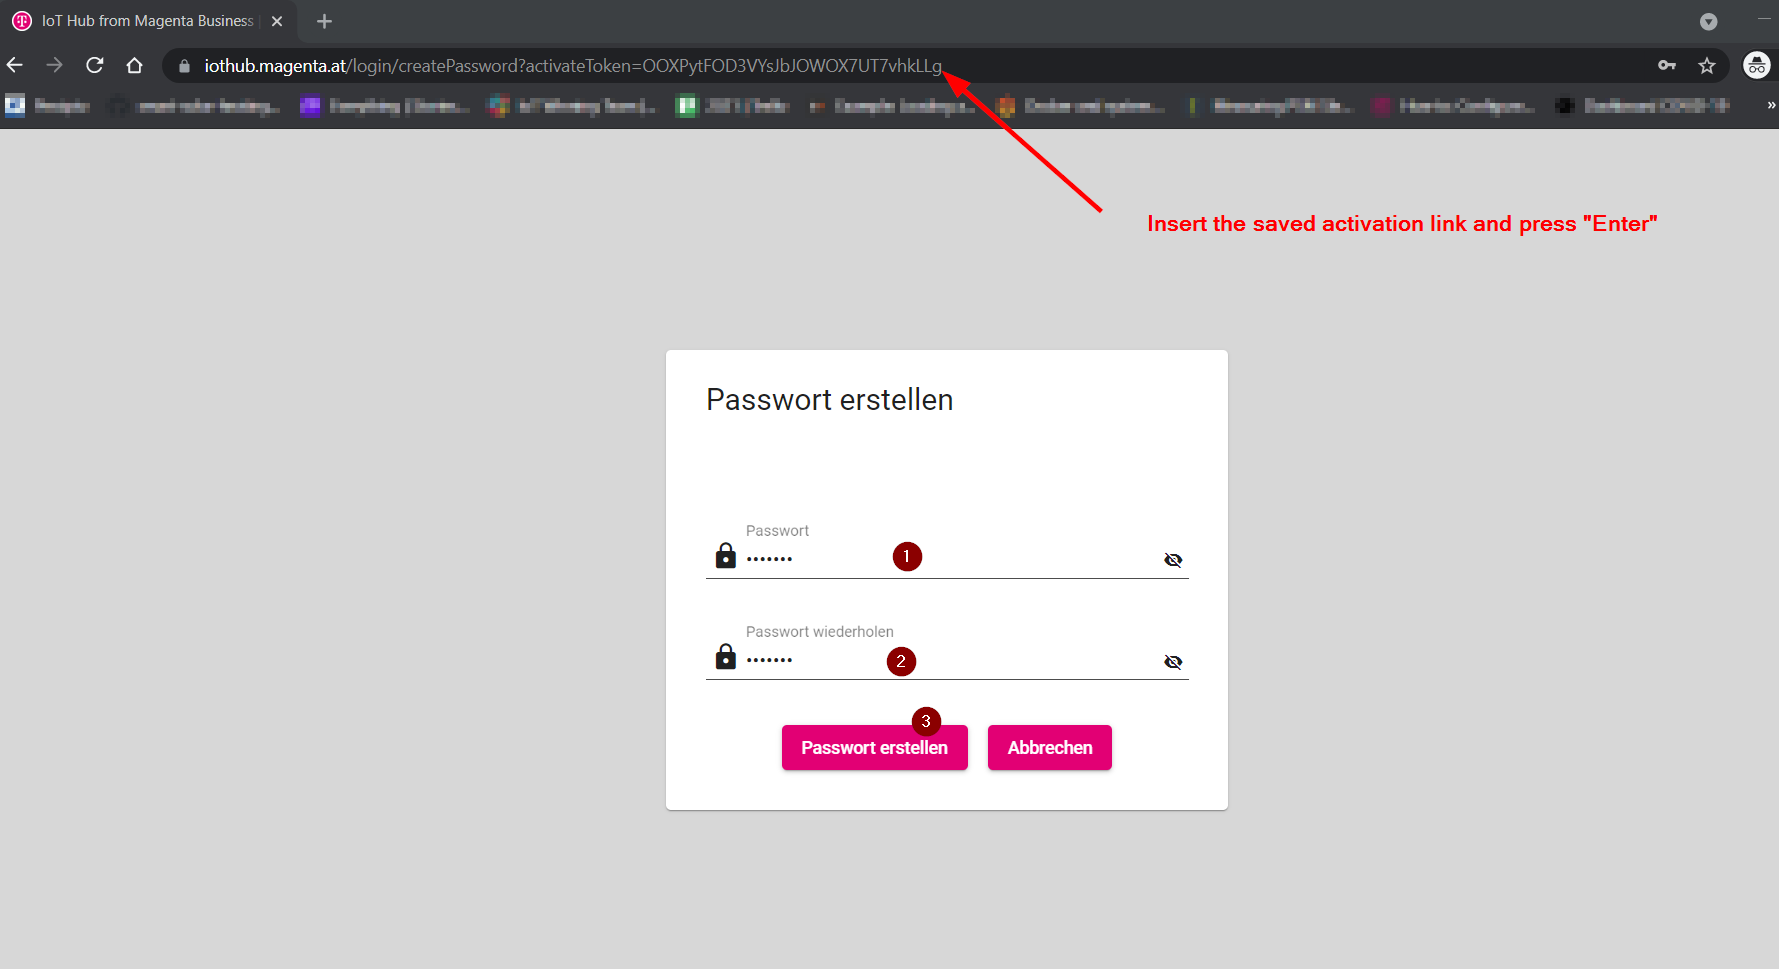
Step 7.5 Activate customer user
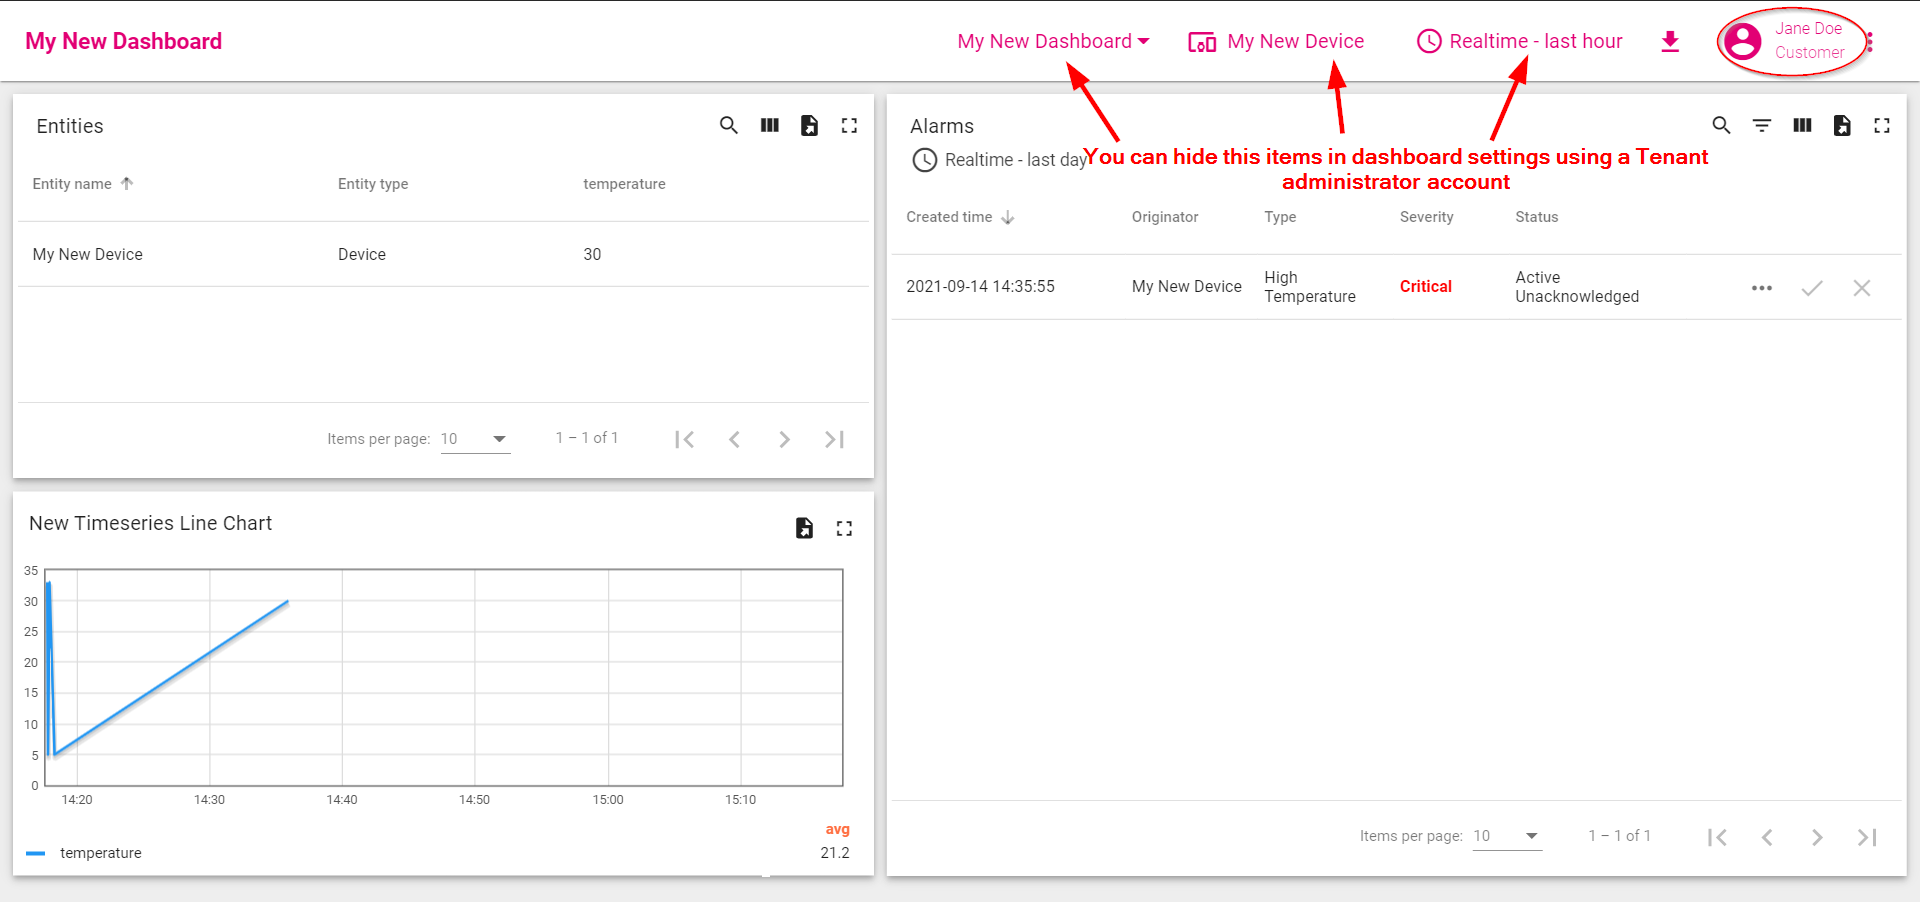
- Use activation link to set the password. Click "Create Password". You will automatically login as a customer user.
- You have logged in as a Customer User. You may browse the data and acknowledge/clear alarms.
Next steps
-
Connect your device - Learn how to connect devices based on your connectivity technology or solution.
-
Data visualization - These guides contain instructions how to configure complex IoT Hub dashboards.
-
Data processing & actions - Learn how to use IoT Hub Rule Engine.
-
IoT Data analytics - Learn how to use rule engine to perform basic analytics tasks.
-
Hardware samples - Learn how to connect various hardware platforms to IoT Hub.
-
Advanced features - Learn about advanced IoT Hub features.