
- Key Concepts
- Predefined Message Types
- Rule Node Types
- Configuration
- Rule Engine Statistics
- Debugging
- Import/Export
- Architecture
- Custom REST API calls to Rule Engine
- Tutorials
- Troubleshooting
IoT Hub Rule Engine is a highly customizable and configurable system for complex event processing. With rule engine you are able to filter, enrich and transform incoming messages originated by IoT devices and related assets. You are also able to trigger various actions, for example, notifications or communication with external systems.
Key Concepts
Rule Engine Message
Rule Engine Message is a serializable, immutable data structure that represent various messages in the system. For example:
- Incoming telemetry, attribute update or RPC call from device;
- Entity life-cycle event: created, updated, deleted, assigned, unassigned, attributes updated;
- Device status event: connected, disconnected, active, inactive, etc;
- Other system events.
Rule Engine Message contains the following information:
- Message ID: time based, universally unique identifier;
- Originator of the message: Device, Asset or other Entity identifier;
- Type of the message: “Post telemetry” or “Inactivity Event”, etc;
- Payload of the message: JSON body with actual message payload;
- Metadata: List of key-value pairs with additional data about the message.
Rule Node
Rule Node is a basic component of Rule Engine that process single incoming message at a time and produce one or more outgoing messages. Rule Node is a main logical unit of the Rule Engine. Rule Node can filter, enrich, transform incoming messages, perform action or communicate with external systems.
Rule Node Relation
Rule Nodes may be related to other rule nodes. Each relation has relation type, a label used to identify logical meaning of the relation. When rule node produces the outgoing message it always specifies the relation type which is used to route message to next nodes.
Typical rule node relations are “Success” and “Failure”. Rule nodes that represent logical operations may use “True” or “False”. Some specific rule nodes may use completely different relation types, for example: “Post Telemetry”, “Attributes Updated”, “Entity Created”, etc.
Rule Chain
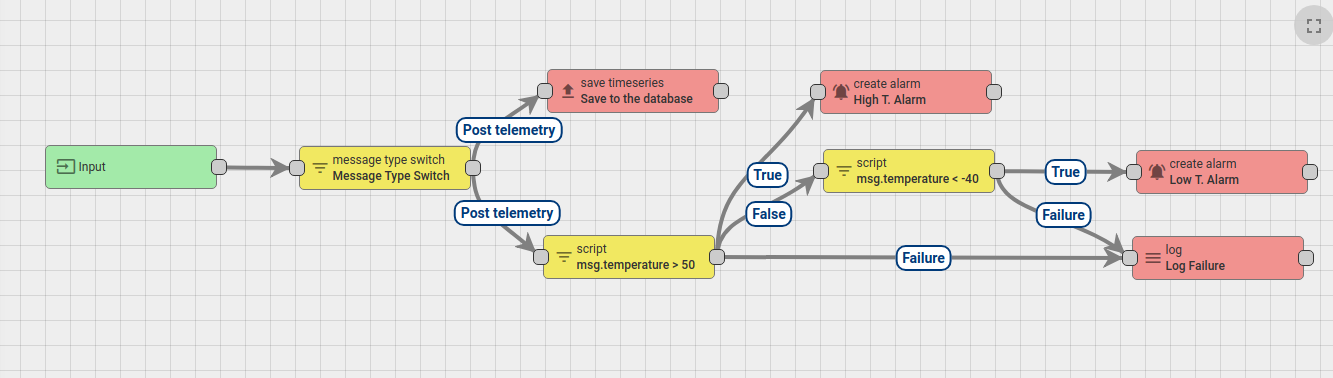
Rule Chain is a logical group of rule nodes and their relations. For example, the rule chain below will:
- save all telemetry messages to the database;
- raise “High Temperature Alarm” if temperature field in the message will be higher then 50 degrees;
- raise “Low Temperature Alarm” if temperature field in the message will be lower then -40 degrees;
- log failure to execute the temperature check scripts to console in case of logical or syntax error in the script.
Tenant administrator is able to define one Root Rule Chain and optionally multiple other rule chains. Root rule chain handles all incoming messages and may forward them to other rule chains for additional processing. Other rule chains may also forward messages to different rule chains.
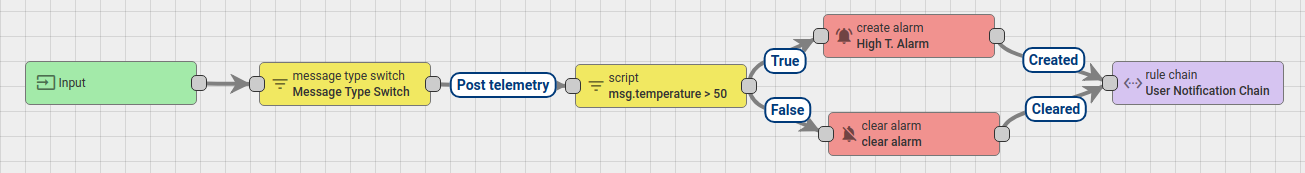
For example, the rule chain below will:
- raise “High Temperature Alarm” if temperature field in the message will be higher then 50 degrees;
- clear “High Temperature Alarm” if temperature field in the message will be less then 50 degrees;
- forward events about “Created” and “Cleared” alarms to external rule chain that handles notifications to corresponding users.
Message Processing Result
There are three possible results of message processing: Success, Failure and Timeout. The message processing attempt is marked as “Success” when the last rule node in the processing chain successfully process the message. The message processing attempt is marked as “Failure” if one of the rule nodes produce “Failure” of message processing, and there is no rule nodes to handle that failure. The message processing attempt is marked as “Timeout” when overall time of processing exceed configurable threshold.
See diagram below and let’s review the possible scenarios:
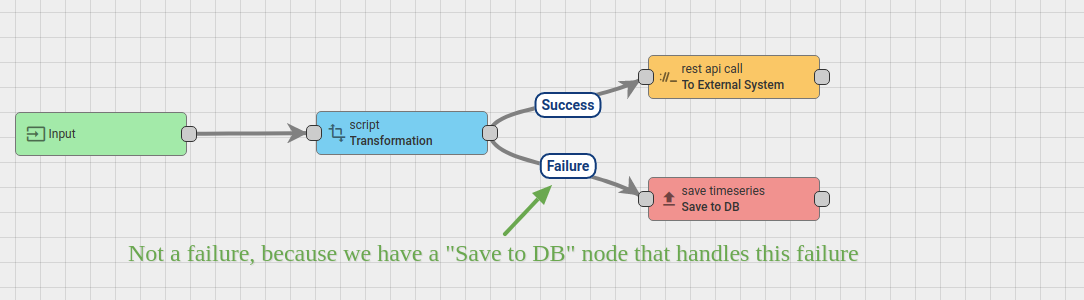
If the “Transformation” script fails, the message is not marked as “Failed”, because there is a “Save to DB” node connected with “Failure” relation. If the “Transformation” script is successful, it will be pushed to “External System” with the REST API call. If the external system is overloaded, the REST API call may “hang” for some time. Let’s assume the overall timeout for message pack processing is 20 seconds. Let’s ignore Transformation script execution time because it is < 1ms. So, if the “External System” will reply within 20 seconds, the message will be successfully processed. Similar, if “Save to DB” call will succeed, the message will be successfully processed. However, if the external system will not reply within 20 seconds, the message processing attempt will be marked as “timed-out”. Similar, if “Save to DB” call will fail, the message will be marked as failed.
Rule Engine Queue
Rule Engine subscribe to queues on startup and polls for new messages. There is always “Main” topic that is used as a main entry point for new incoming messages. You may configure multiple queues using thingsboard.yml or environment variables. Once configured, you may put message to the other topic using “Checkpoint” node. This automatically acknowledges corresponding message in the current topic.
The definition of the queue consists of the following parameters:
- name - used for statistics and logging;
- topic - used by Queue implementations to produce and consume messages;
- poll-interval - duration in milliseconds between polling of the messages if no new messages arrive;
- partitions - number of partitions to associate with this queue. Used for scaling the number of messages that can be processed in parallel;
- pack-processing-timeout - interval in milliseconds for processing of the particular pack of messages returned by consumer;
- submit-strategy - defines logic and order of submitting messages to rule engine. See separate paragraph below.
- processing-strategy - defines logic of acknowledgement of the messages. See separate paragraph below.
Queue submit strategy
Rule Engine service constantly polls messages for specific topic and once the Consumer returns a list of messages it creates the TbMsgPackProcessingContext object. Queue submit strategy controls how messages from TbMsgPackProcessingContext are submitted to rule chains. There are 5 available strategies:
- BURST - all messages are submitted to the rule chains in the order they arrive.
- BATCH - messages are grouped to batches using “queue.rule-engine.queues[queue index].batch-size” configuration parameter. New batch is not submitted until previous batch is acknowledged.
- SEQUENTIAL_BY_ORIGINATOR - messages are submitted sequentially within particular entity (originator of the message). New message for e.g. device A is not submitted until previous message for device A is acknowledged.
- SEQUENTIAL_BY_TENANT - messages are submitted sequentially within tenant (owner of the originator of the message). New message for e.g tenant A is not submitted until previous message for tenant A is acknowledged.
- SEQUENTIAL - messages are submitted sequentially. New message is not submitted until previous message is acknowledged. This makes processing quite slow.
See this guide for an example of submit strategy use case.
Queue processing strategy
Processing Strategy controls how failed or timed out messages are re-processed. There are 5 available strategies:
- SKIP_ALL_FAILURES - simply ignore all failures and timeouts. Will cause messages to be “lost”. For example, if DB is down, the messages will not be persisted but will be still marked as “acknowledged” and deleted from queue. This strategy is created mostly for backward-compatibility with previous releases and development/demo environments.
- RETRY_ALL - retry all messages from processing pack. If 1 out of 100 messages will fail, strategy will still reprocess (resubmit to Rule Engine) 100 messages.
- RETRY_FAILED - retry all failed messages from processing pack. If 1 out of 100 messages will fail, strategy will reprocess(resubmit to Rule Engine) only 1 message. Timed-out messages will not be reprocessed.
- RETRY_TIMED_OUT - retry all timed-out messages from processing pack. If 1 out of 100 messages will timeout, strategy will reprocess(resubmit to Rule Engine) only 1 message. Failed messages will not be reprocessed.
- RETRY_FAILED_AND_TIMED_OUT - retry all failed and timed-out messages from processing pack.
All “RETRY*” strategies support important configuration parameters:
- retries - Number of retries, 0 is unlimited
- failure-percentage - Skip retry if failures or timeouts are less then X percentage of messages;
- pause-between-retries - Time in seconds to wait in consumer thread before retries;
See this guide for an example of processing strategy use case.
Default queues
There are three default queues configured: Main, HighPriority and SequentialByOriginator. They differ based on submit and processing strategy. Basically, rule engine process messages from Main topic and may optionally put them to other topics using “Checkpoint” rule node. Main topic simply ignores failed messages by default. This is done for backward compatibility with previous releases. However, you may reconfigure this at your own risk. Note that if one message is not processed due to some failure in your rule node script, it may prevent next messages from being processed. We have designed specific dashboard to monitor Rule Engine processing and failures.
The HighPriority topic may be used for delivery of alarms or other critical processing steps. The messages in HighPriority topic are constantly reprocessed in case of failure until the message processing succeeds. This is useful if you have an outage of the SMTP server or external system. The Rule Engine will retry sending the message until it is processed.
The SequentialByOriginator topic is important if you would like to make sure that messages are processed in correct order. Messages from the same entity will be processed with the order they arrive to the queue. Rule Engine will not submit new message to the rule chain until the previous message for the same entity id is acknowledged.
Predefined Message Types
List of the predefined Message Types is presented in the following table:
| Message Type | Display Name | Description | Message metadata | Message payload |
| POST_ATTRIBUTES_REQUEST | Post attributes | Request from device to publish client side attributes (see attributes api for reference) | deviceName - originator device name, deviceType - originator device type |
key/value json: { |
| POST_TELEMETRY_REQUEST | Post telemetry | Request from device to publish telemetry (see telemetry upload api for reference) | deviceName - originator device name, deviceType - originator device type, ts - timestamp (milliseconds) |
key/value json: { |
| TO_SERVER_RPC_REQUEST | RPC Request from Device | RPC request from device (see client side rpc for reference) | deviceName - originator device name, deviceType - originator device type, requestId - RPC request Id provided by client |
json containing method and params: { |
| RPC_CALL_FROM_SERVER_TO_DEVICE | RPC Request to Device | RPC request from server to device (see server side rpc api for reference) | requestUUID - internal request id used by sustem to identify reply target, expirationTime - time when request will be expired, oneway - specifies request type: true - without response, false - with response |
json containing method and params: { |
| ACTIVITY_EVENT | Activity Event | Event indicating that device becomes active | deviceName - originator device name, deviceType - originator device type |
json containing device activity information: { |
| INACTIVITY_EVENT | Inactivity Event | Event indicating that device becomes inactive | deviceName - originator device name, deviceType - originator device type |
json containing device activity information, see Activity Event payload |
| CONNECT_EVENT | Connect Event | Event produced when device is connected | deviceName - originator device name, deviceType - originator device type |
json containing device activity information, see Activity Event payload |
| DISCONNECT_EVENT | Disconnect Event | Event produced when device is disconnected | deviceName - originator device name, deviceType - originator device type |
json containing device activity information, see Activity Event payload |
| ENTITY_CREATED | Entity Created | Event produced when new entity was created in system | userName - name of the user who created the entity, userId - the user Id |
json containing created entity details: { |
| ENTITY_UPDATED | Entity Updated | Event produced when existing entity was updated | userName - name of the user who updated the entity, userId - the user Id |
json containing updated entity details, see Entity Created payload |
| ENTITY_DELETED | Entity Deleted | Event produced when existing entity was deleted | userName - name of the user who deleted the entity, userId - the user Id |
json containing deleted entity details, see Entity Created payload |
| ENTITY_ASSIGNED | Entity Assigned | Event produced when existing entity was assigned to customer | userName - name of the user who performed assignment operation, userId - the user Id, assignedCustomerName - assigned customer name, assignedCustomerId - Id of assigned customer |
json containing assigned entity details, see Entity Created payload |
| ENTITY_UNASSIGNED | Entity Unassigned | Event produced when existing entity was unassigned from customer | userName - name of the user who performed unassignment operation, userId - the user Id, unassignedCustomerName - unassigned customer name, unassignedCustomerId - Id of unassigned customer |
json containing unassigned entity details, see Entity Created payload |
| ADDED_TO_ENTITY_GROUP | Added to Group | Event produced when entity was added to Entity Group. This Message Type is specific to IoT Hub. | userName - name of the user who performed assignment operation, userId - the user Id, addedToEntityGroupName - entity group name, addedToEntityGroupId - Id of entity group |
empty json payload |
| REMOVED_FROM_ENTITY_GROUP | Removed from Group | Event produced when entity was removed from Entity Group. This Message Type is specific to IoT Hub. | userName - name of the user who performed unassignment operation, userId - the user Id, removedFromEntityGroupName - entity group name, removedFromEntityGroupId - Id of entity group |
empty json payload |
| ATTRIBUTES_UPDATED | Attributes Updated | Event produced when entity attributes update was performed | userName - name of the user who performed attributes update, userId - the user Id, scope - updated attributes scope (can be either SERVER_SCOPE or SHARED_SCOPE) |
key/value json with updated attributes: { |
| ATTRIBUTES_DELETED | Attributes Deleted | Event produced when some of entity attributes were deleted | userName - name of the user who deleted attributes, userId - the user Id, scope - deleted attributes scope (can be either SERVER_SCOPE or SHARED_SCOPE) |
json with attributes field containing list of deleted attributes keys: { |
| ALARM | Alarm event | Event produced when an alarm was created, updated or deleted |
All fields from original Message Metadata
isNewAlarm - true if a new alram was just created isExistingAlarm - true if an alarm is existing already isClearedAlarm - true if an alarm was cleared |
json containing created alarm details:
{
|
| REST_API_REQUEST | REST API Request to Rule Engine | Event produced when user executes REST API call | requestUUID - the unique request id, expirationTime - the expiration time of the request |
json with request payload |
Rule Node Types
All available rule nodes are grouped in correspondence with their nature:
- Filter Nodes are used for message filtering and routing;
- Enrichment Nodes are used to update meta-data of the incoming Message;
- Transformation Nodes are used for changing incoming Message fields like Originator, Type, Payload, Metadata;
- Action Nodes execute various actions based on incoming Message;
- External Nodes are used to interact with external systems.
Configuration
Each Rule Node may have specific configuration parameters that depend on the Rule Node Implementation. For example, “Filter - script” rule node is configurable via custom JS function that process incoming data. “External - send email” node configuration allows to specify mail server connection parameters.
Rule Node configuration window may be opened by double-clicking on the node in the Rule Chain editor:
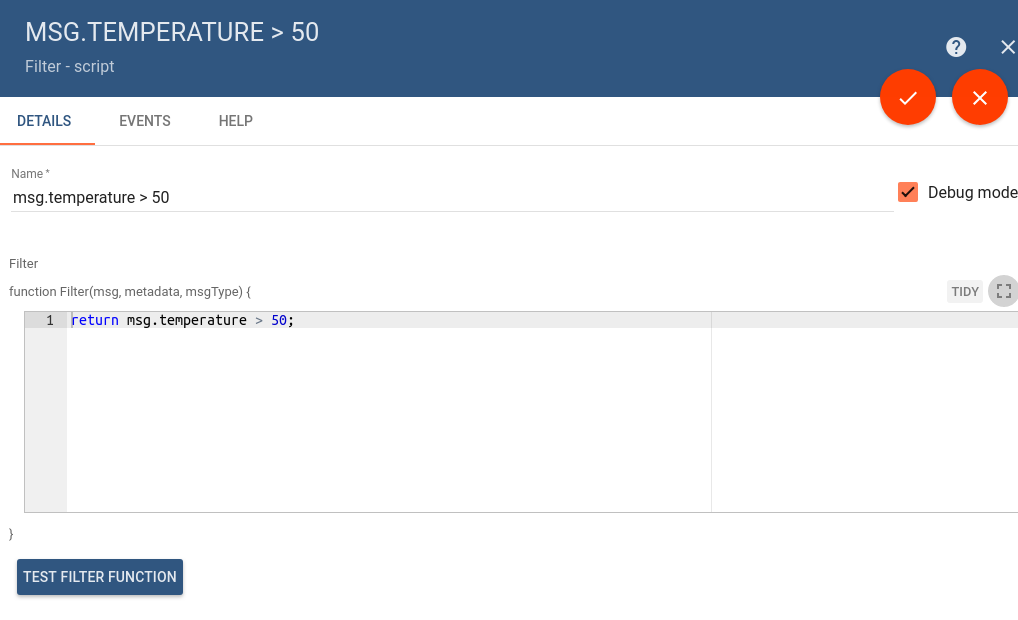
Test JavaScript functions
Some rule nodes have specific UI feature that allow users to test JS functions. Once you click on the Test Filter Function you will see the JS Editor that allows you to substitute input parameters and verify the output of the function.
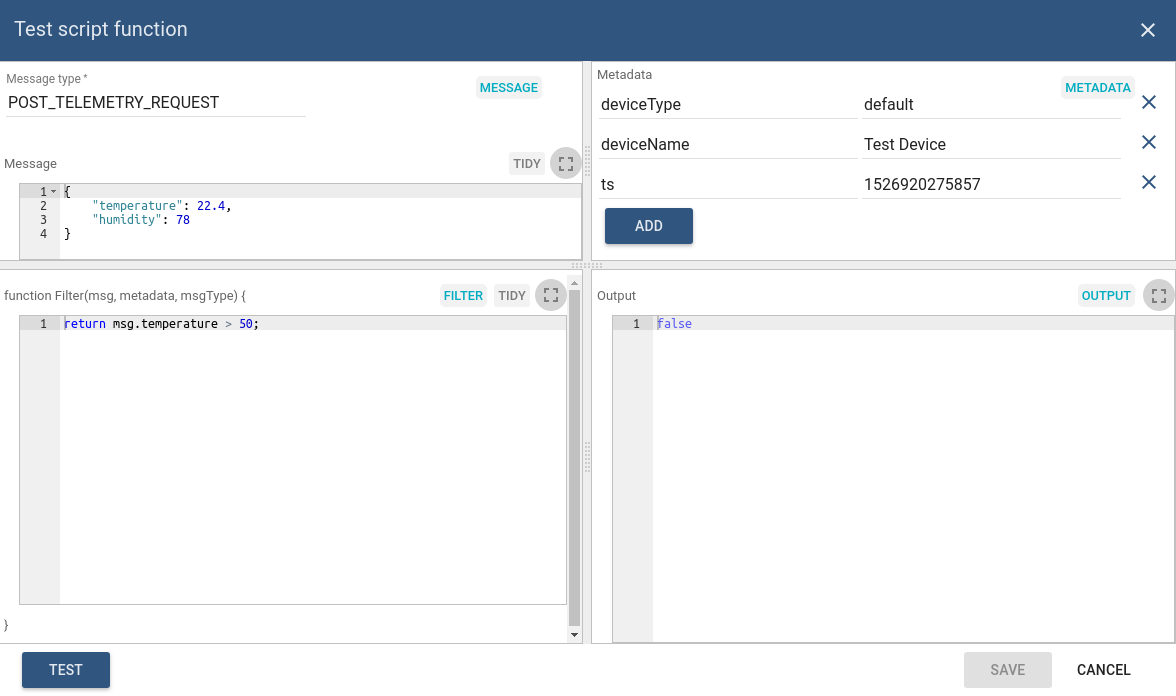
You can define:
- Message Type in the top left field.
- Message payload in the left Message section.
- Metadata in right Metadata section.
- Actual JS script in Filter section.
After pressing Test output will be returned in right Output section.
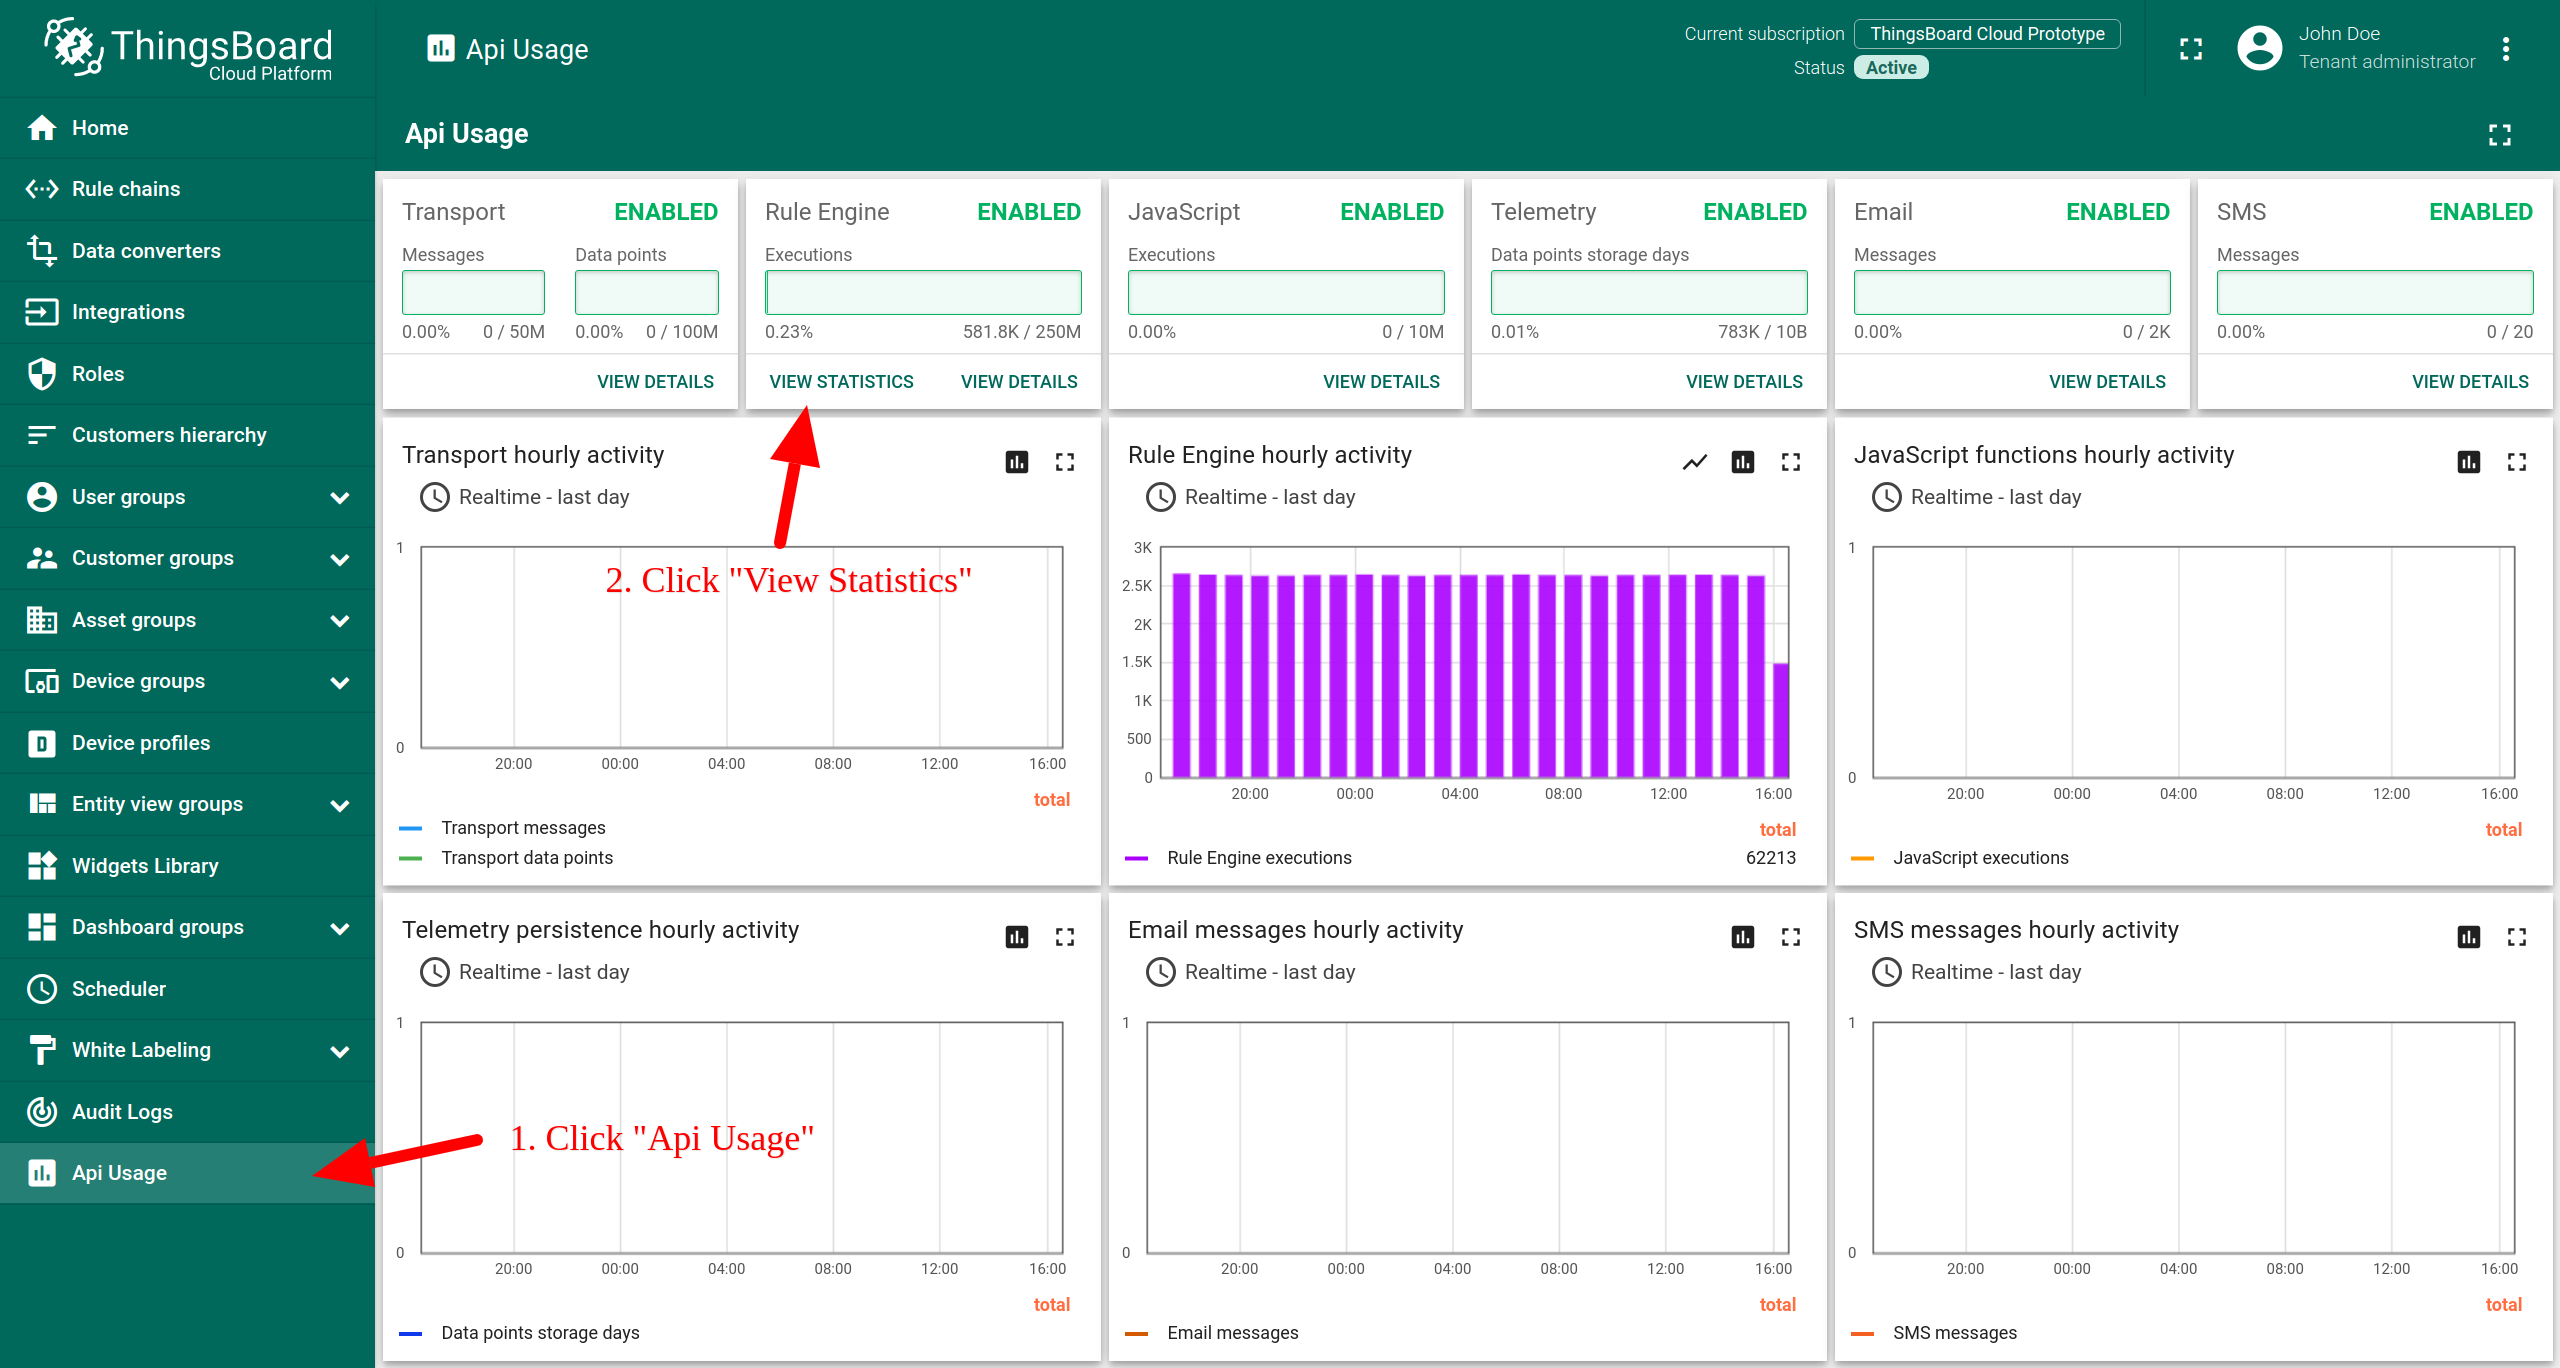
Rule Engine Statistics
IoT Hub Team have prepared the “default” dashboard for Rule Engine statistics. This dashboard is automatically loaded for each tenant. You may access it by navigating to “Api Usage”->”View statistics” (see screen below).
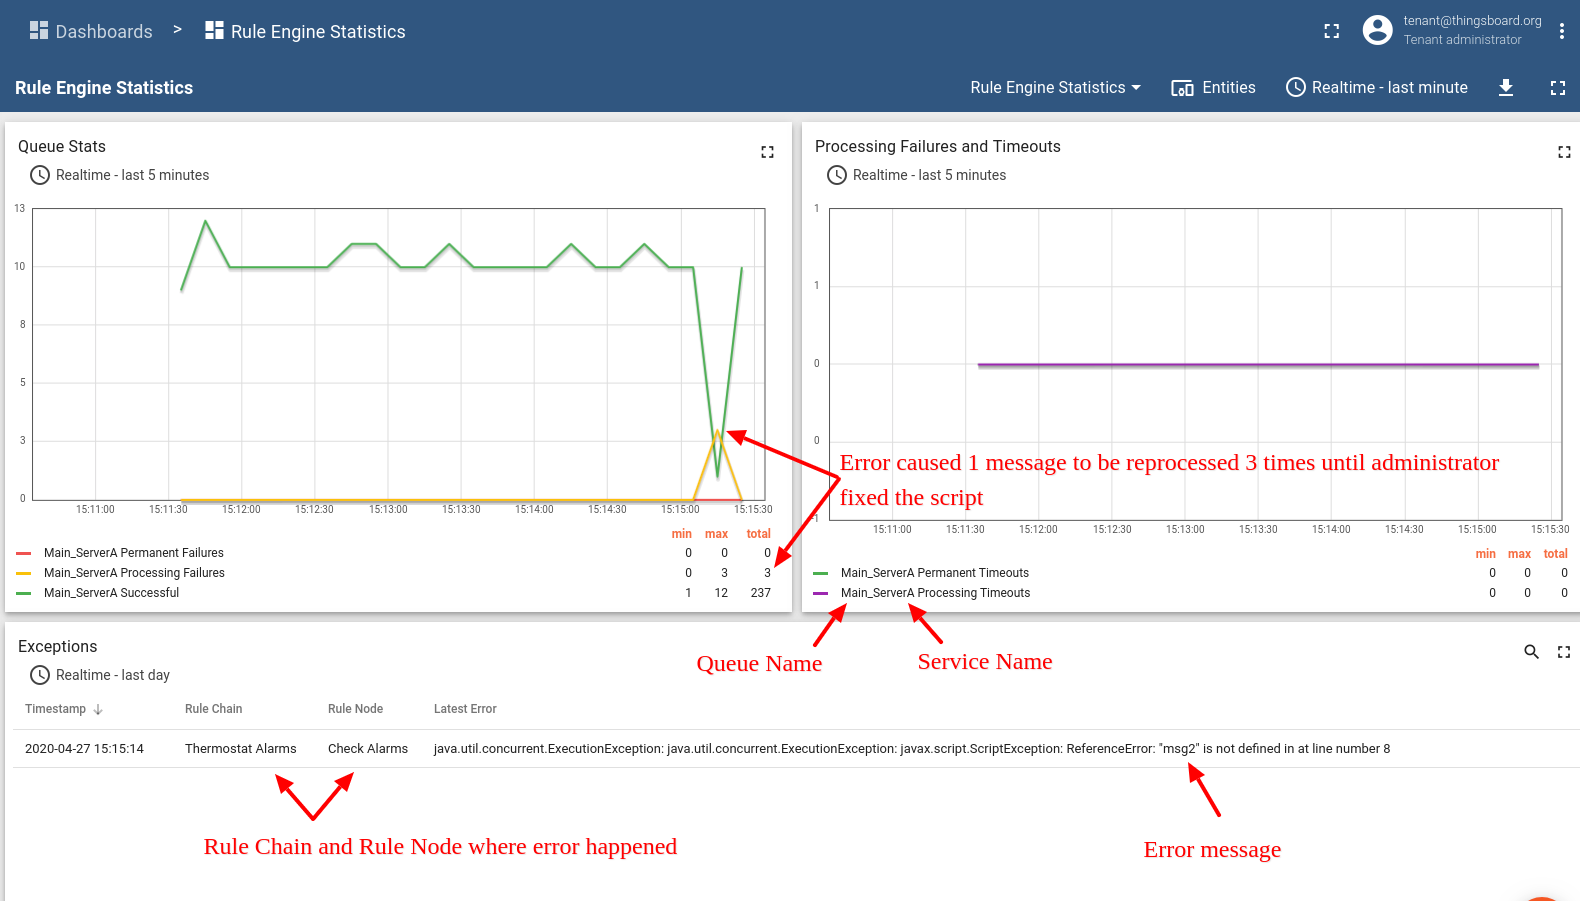
The statistics collection is enabled by default and is controlled via configuration properties.
You may notice insights about errors in processing and what causes them on the dashbaord below:
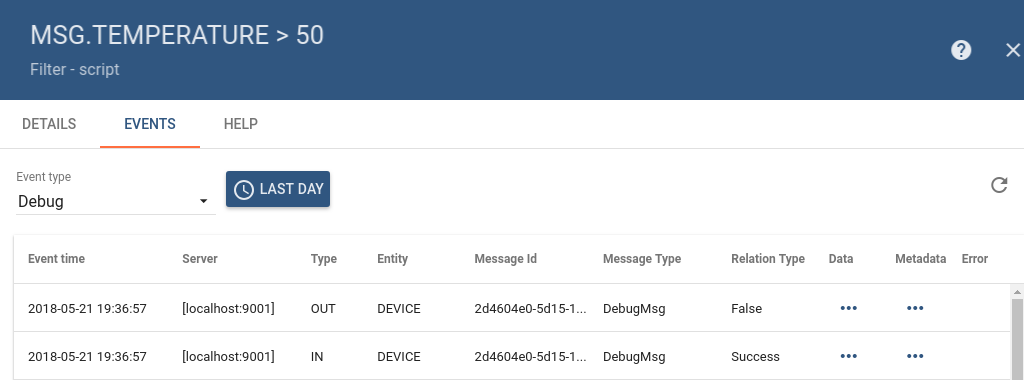
Debugging
IoT Hub provides ability to review incoming and outgoing messages for each Rule Node. To enable debug, user need to ensure that “Debug mode” checkbox is selected in the main configuration window (see first image in the Configuration section).
Once debug is enabled, user is able to see incoming and outgoing messages info as long as corresponding relation types. See image below for a sample debug messages view:
Import/Export
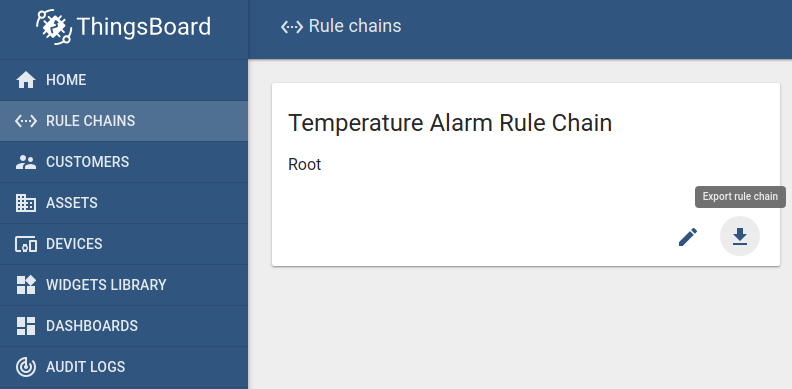
You are able to export your rule chain to JSON format and import it to the same or another IoT Hub instance.
In order to export rule chain, you should navigate to the Rule Chains page and click on the export button located on the particular rule chain card.
Similar, to import the rule chain you should navigate to the Rules Chains page and click on the big “+” button in the bottom-right part of the screen and then click on the import button.
Architecture
To learn more about internals of the rule engine, see architecture page.
Custom REST API calls to Rule Engine
IoT Hub provides API to send custom REST API calls to the rule engine, process the payload of the request and return result of the processing in response body. This is useful for a number of use cases. For example:
- extend existing REST API of the platform with custom API calls;
- enrich REST API call with the attributes of device/asset/customer and forward to external system for complex processing;
- provide custom API for your custom widgets.
To execute the REST API call, you may use rule-engine-controller REST APIs:
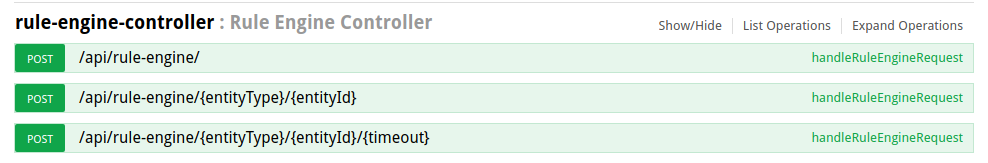
Note: the entity id you have specified in the call will be the originator of Rule Engine message. If you do not specify the entity id parameters, your user entity will become an originator of the message.
Tutorials
IoT Hub authors have prepared several tutorials to help you get started with designing rule chains by example:
- Transform incoming messages from device
- Transform incoming messages using previous messages from device
- Create and clear alarms on incoming device messages
- Send emails to customer on device alarm
- Send messages between related devices
See more tutorials here.
Troubleshooting
If you are using Kafka queue for processing messages, IoT Hub provides the ability to monitor if the rate of pushing messages to the Kafka is faster than rate of consuming and processing them (in such case you will have a growing latency for message processing). To enable this functionality, you need to ensure that Kafka consumer-stats are enabled (see queue.kafka.consumer-stats section of the Configuration properties)
Once Kafka consumer-stats are enabled, you will see logs (see Troubleshooting) about offset lag for consumer groups (there are consumer-group logs for tb-core, tb-rule-engine and all transport services).
Here’s an example of the log message:
1
2021-03-19 15:01:59,794 [kafka-consumer-stats-11-thread-1] INFO  o.t.s.q.k.TbKafkaConsumerStatsService - [re-Main-consumer] Topic partitions with lag: [[topic=[tb_rule_engine.main.0], partition=[0], committedOffset=[5413], endOffset=[5418], lag=[5]]].
From this message we can see that there are 5 (5418 - 5413 = 5) messages pushed to the Main queue (tb_rule_engine.main.0 Kafka topic) but not yet processed.
In general the logs have the following structure:
1
TIME [STATS_PRINTING_THREAD_NAME] INFO  o.t.s.q.k.TbKafkaConsumerStatsService - [CONSUMER_GROUP_NAME] Topic partitions with lag: [[topic=[KAFKA_TOPIC], partition=[KAFKA_TOPIC_PARTITION], committedOffset=[LAST_PROCESSED_MESSAGE_OFFSET], endOffset=[LAST_QUEUED_MESSAGE_OFFSET], lag=[LAG]],[topic=[ANOTHER_TOPIC], partition=[], committedOffset=[], endOffset=[], lag=[]],...].
Where:
CONSUMER_GROUP_NAME- name of the consumer group which is processing messages (could be any of the rule-engine queues, core queue etc)KAFKA_TOPIC- name of the exact Kafka topicKAFKA_TOPIC_PARTITION- number of the topic’s partitionLAST_PROCESSED_MESSAGE_OFFSET- the sequence number of the last message which was processed by the consumer (last acknowledged message in the Rule Engine etc)LAST_QUEUED_MESSAGE_OFFSET- the sequence number of the last message that was successfully pushed to the Kafka topicLAG- the amount of unprocessed messages
NOTE: Logs about consumer lag are printed only if there is a lag for this consumer group.